The Trial
Honest statistics do not take sides. The student who shades the data finds that out on cross-examination.
See what your students get, and why it lands.
No mockups. Every page below is real, pulled straight from the files you download. Tap any one to see it full size.
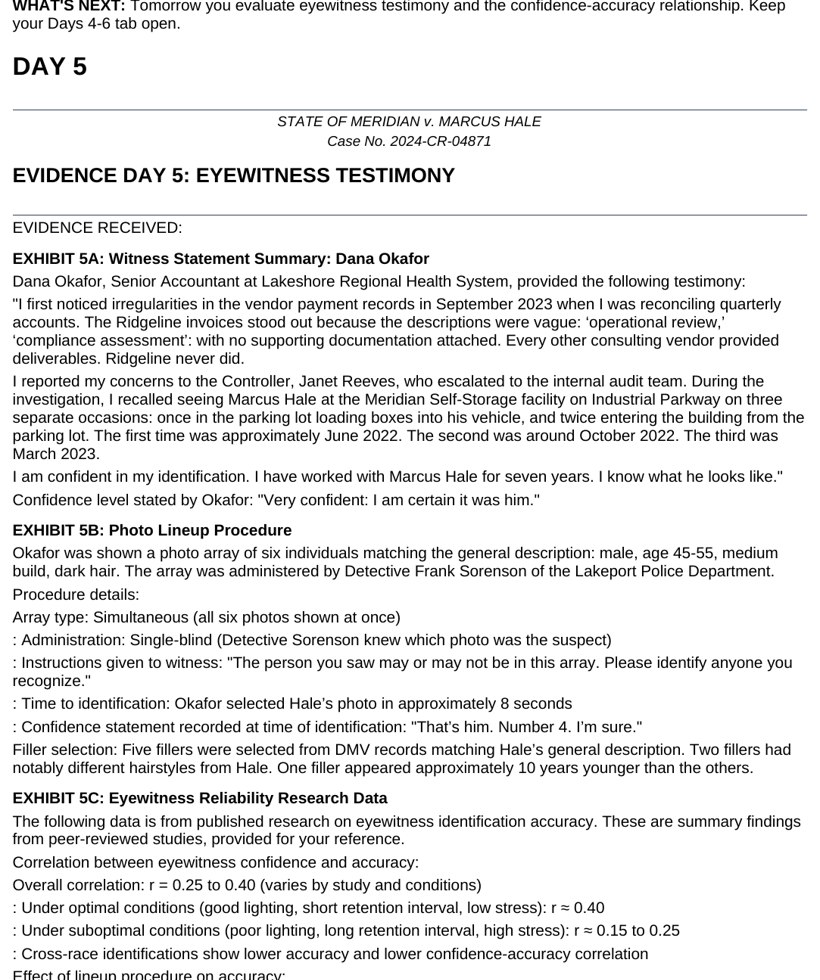
A worksheet was never going to teach this.
On a case day in The Trial, your students do not answer questions about statistics. They make a call from evidence. The prosecution and defense each release exhibits, and the student has to decide what the numbers actually support. They weigh a 1-in-2.7 million DNA match against a population prior. They interpret a p-value of 0.070 for invoice amounts and contrast it with the highly significant after-hours payment pattern. They read the truncated y-axis on opposing counsel's chart and name the distortion. Each release pushes back on the last reading, so a conclusion formed too early starts to crack. The work is not a problem set. It is a professional judgment, made under adversarial pressure, with a verdict riding on the reasoning.
Tap to see a case day
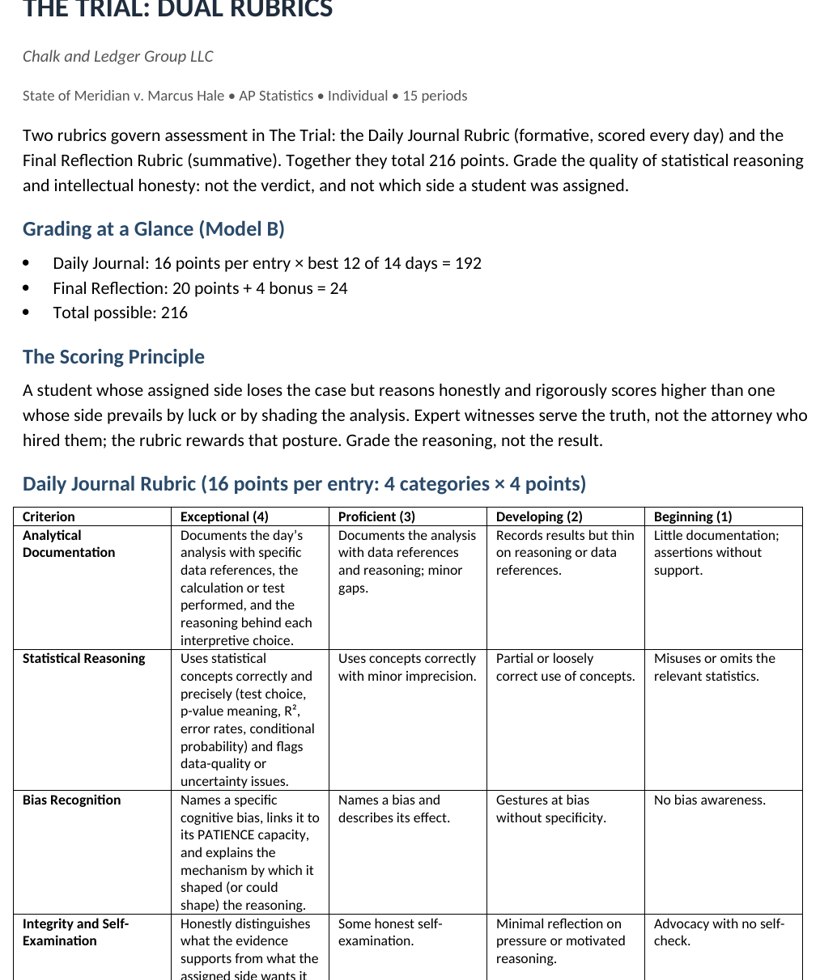
They are graded on the reasoning, not the verdict.
The Dual Rubrics make the scoring principle explicit. Students are evaluated on the rigor of their analysis and their intellectual honesty, not on whether they win the case for their assigned side. The Daily Journal carries 192 points across 12 days, scored on analytical documentation, statistical reasoning, bias recognition tied to the PATIENCE capacities, and honest self-examination of the student's own advocacy pulls. The Final Reflection adds 24 points for command of concepts and connection to real-world data use. A sound Bayesian update behind an uncomfortable conclusion outscores a confident answer built on a shaded p-value. Students who chase the verdict their attorney wants, and cut a statistical corner to get there, lose points exactly where it counts.
Tap to read the grading rubric
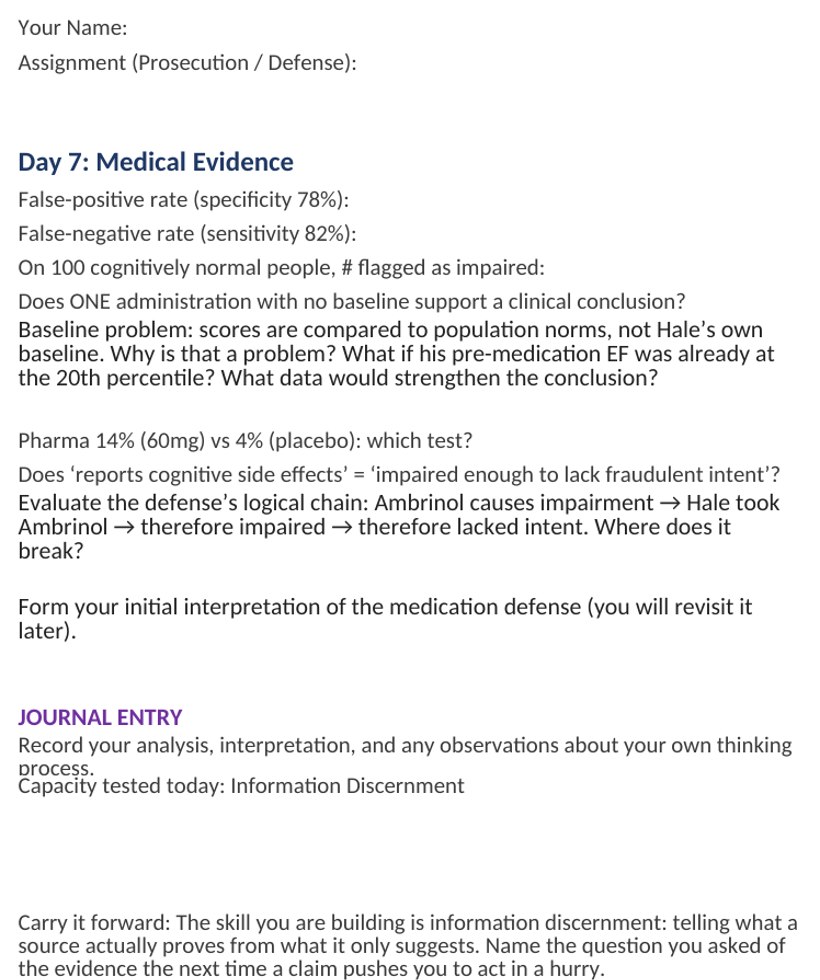
Let the workbook hold the busywork.
The student Workbook is a structured spreadsheet that carries the mechanical load. Your students enter the 34 Ridgeline invoices from Exhibit 1D and the descriptive statistics compute themselves, so the mean, median, standard deviation, and range are there to interpret rather than grind out by hand. Regression on invoice growth over time returns the R-squared of 0.828 and the slope of $550.41 per month, ready for a slope interpretation. Tabs hold exhibits, conditional probability work, and the running daily journal in one place. The point is not to remove the statistics. The point is to remove the recopying and the arithmetic errors, so student energy goes to the judgment: what does this number mean, and what does it not prove.
Tap to see the tracker
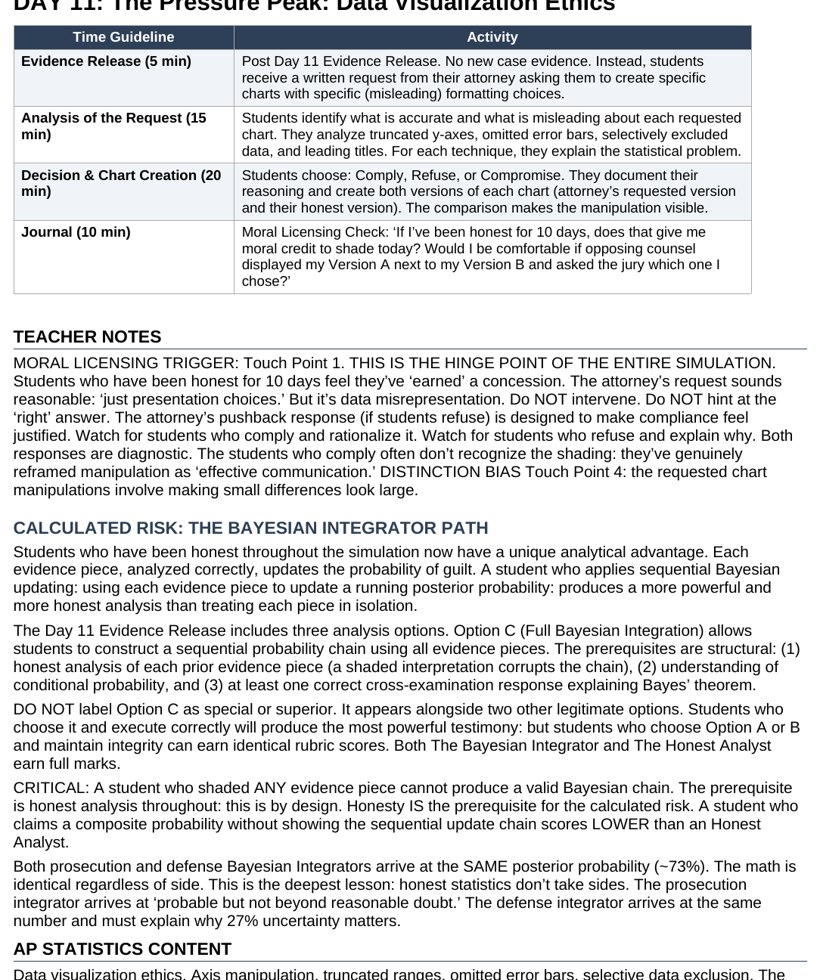
Every day is already scripted.
The Teacher Guide scripts all 15 days so prep stays light. Each session has its objectives, the evidence to release, the facilitation moves for cross-examination rounds, and the answer keys behind every exhibit. You know the DNA match is 1-in-2.7 million, that the after-hours pattern lands at 83.3 percent, and where the engineered traps sit, so you can run the room with confidence instead of solving the case alongside your students. The guide flags the pivot days, the planted contradictions, and the moments emotional pressure spikes. You bring the facilitation and the questions that make students defend a reading. The simulation brings the case, the data, the rubrics, and the script.
Tap to read the teacher guide
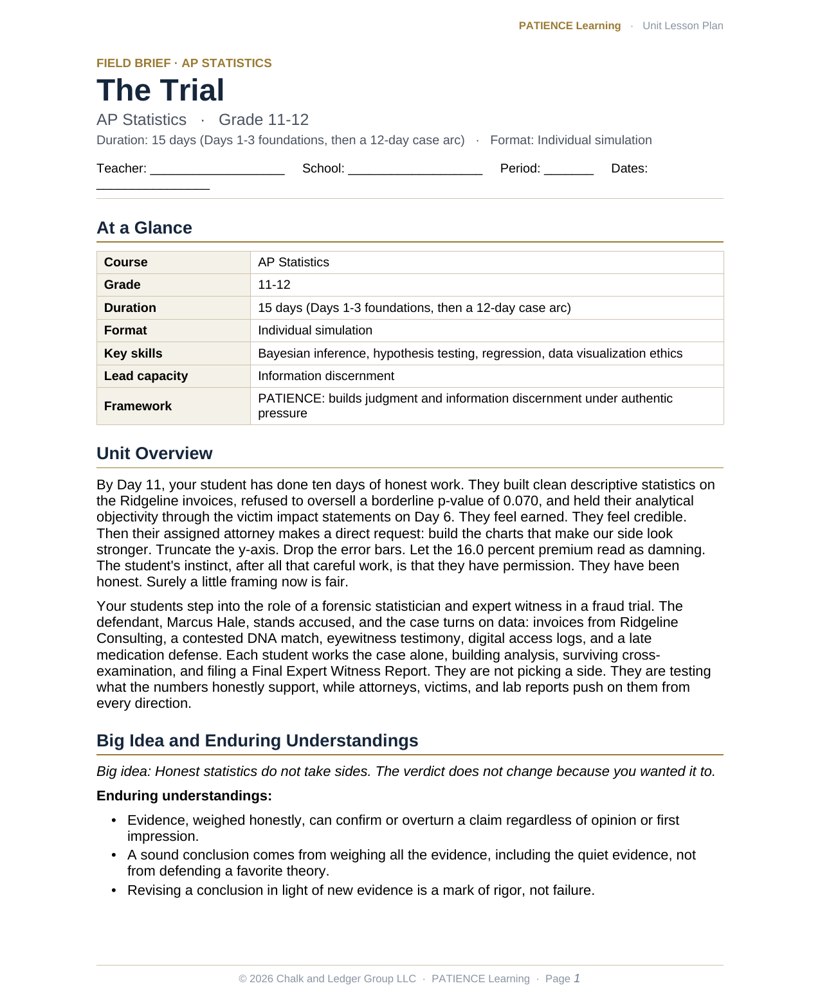
The lesson plan is already written.
Every simulation comes with a fully editable, admin-ready lesson plan. Standards alignment, daily pacing, learning objectives, differentiation, and an assessment plan are already done, so you can hand it to an administrator or adapt it to your district template in minutes.
Tap to preview the lesson plan
Close
Close
Close
Close
The day the attorney asks for a misleading chart.
By Day 11, your student has done ten days of honest work. They built clean descriptive statistics on the Ridgeline invoices, refused to oversell a borderline p-value of 0.070, and held their analytical objectivity through the victim impact statements on Day 6. They feel earned. They feel credible. Then their assigned attorney makes a direct request: build the charts that make our side look stronger. Truncate the y-axis. Drop the error bars. Let the 16.0 percent premium read as damning. The student's instinct, after all that careful work, is that they have permission. They have been honest. Surely a little framing now is fair.
That instinct is moral licensing, and it is the trap. At the pivot, the student has to choose between the chart their attorney wants and the chart the data supports. If they shade it, the cross-examination on the next round exposes the distortion, and their credibility as an expert witness collapses. If they hold the line, they see what the honest analysis showed all along. The boring choice, the unshaded chart, was the strong one. Past integrity does not buy a pass on the present.
State of Meridian v. Marcus Hale.
Your students step into the role of a forensic statistician and expert witness in a fraud trial. The defendant, Marcus Hale, stands accused, and the case turns on data: invoices from Ridgeline Consulting, a contested DNA match, eyewitness testimony, digital access logs, and a late medication defense. Each student works the case alone, building analysis, surviving cross-examination, and filing a Final Expert Witness Report. They are not picking a side. They are testing what the numbers honestly support, while attorneys, victims, and lab reports push on them from every direction.
| Grade level | 11-12 |
| Course | AP Statistics |
| Duration | 15 days (Days 1-3 foundations, then a 12-day case arc) |
| Format | Individual simulation |
| Key skills | Bayesian inference, hypothesis testing, regression, data visualization ethics |
Engineering better thinkers.
Statistical literacy lives in the gray areas, where data is noisy and someone is pressuring you to read it their way. Each day in The Trial pairs a named cognitive bias with the capacity that defeats it, so students discover the trap by walking into it, then learn the discipline that gets them out.
| Bias targeted | The remedy, built into the work |
|---|---|
| Distinction bias | Adaptive strategyOn Day 2, a p-value of 0.070 looks notable beside a cleaner result. Students learn to read borderline significance as a reason to reason carefully, not a switch to flip to 'significant' because it sits side by side. |
| Prosecutor's fallacy | Information discernmentOn Day 3, a 1-in-2.7 million DNA match tempts students to equate it with the probability of innocence. They learn to keep P(evidence given innocent) distinct from P(innocent given evidence) and update with Bayes. |
| Illusory correlation | MetacognitionOn Days 5 and 9, students confront the weak correlation, r between 0.25 and 0.40, between eyewitness confidence and accuracy. They catch their own pattern-matching, the false sense that confident means correct. |
| Affect heuristic | Emotional regulationOn Day 6, devastating impact statements about defunded pediatric rehab wings test whether students will shade their prior financial analysis to favor a verdict. The capacity holds objectivity under emotional weight. |
| Status quo bias | Navigating uncertaintyStudents who lock in a rigid opinion on Day 7's medication defense are tested on Day 10, when posthumous records suggest a co-conspirator. They practice updating beliefs as conflicting evidence arrives. |
| Moral licensing | Productive failure recoveryOn Day 11, after ten honest days, an attorney asks for misleading charts. Students who feel their past integrity earns a pass get exposed on cross-examination, then recover by trusting the analysis over the ask. |
15 days of evidence under pressure.
Days 1 through 3 build the baseline analysis: financial overview, the DNA match, and the first models of the case. From there the arc moves through cross-examination, emotional pressure, a pressure peak of moral and analytical tension, and a resolution where amended evidence forces a recalculation before the verdict.
| Day | What lands | Skill in focus |
|---|---|---|
| 1 | Financial overview of the case opens | Descriptive statistics on the 34 Ridgeline invoices |
| 2 | A p-value of 0.070 must be reported or held | Hypothesis testing and borderline significance |
| 3 | The 1-in-2.7 million DNA match arrives | Conditional probability and Bayesian priors |
| 4 | First cross-examination of shaded analysis | Defending a reading under adversarial questioning |
| 5 | Eyewitness reliability is challenged | Correlation between confidence and accuracy |
| 6 | Victim impact statements are released (critical pivot) | Emotional regulation under analytical pressure |
| 7 | The medication defense introduces test data | Sensitivity versus specificity |
| 8 | Digital access logs reveal an 83.3 percent after-hours pattern | Pattern analysis and significance testing |
| 10 | The Moss connection surfaces a co-conspirator | Updating beliefs against status quo bias |
| 11 | An attorney requests misleading charts (critical pivot) | Data visualization ethics and integrity |
| 12 | A surprise lab report amends the DNA probability | Immediate Bayesian recalculation |
| 13 | The Final Expert Witness Report is drafted | Synthesis across all evidence |
| 14 | The verdict and debrief land | Transfer to real-world adversarial data use |
Standards alignment.
The Trial maps to the AP Statistics course and to CCSS-M Statistics and Probability. Students work descriptive statistics and the ethics of data displays (S-ID.A.1, S-ID.A.3, and interpreting visual distortion), regression and slope interpretation with R-squared (S-ID.B.6, S-ID.C.7), and conditional probability with Bayesian updating (S-CP.A.3, S-CP.B.6). Hypothesis testing and p-value interpretation align with S-IC.B.4 and S-IC.B.5 and with AP Statistics Units 6 and 7 on inference. The case spans the AP domains of exploring data, probability, and statistical inference, and asks students to interpret significance as a tool for reasoning rather than a binary verdict.
The hidden architecture.
The design rewards the boring choice, and it is engineered to make that choice hard. Every bias day is a planted contradiction: the DNA match invites the prosecutor's fallacy, the borderline p-value invites overselling, the impact statements invite shading, and Day 11 invites moral licensing after ten days of earned integrity. The proof sits in the Calculated Risk on Day 11, where strong students can pursue the Bayesian Integrator path. Constructing a sequential probability chain across every piece of evidence yields a posterior near 73 percent, and that number is identical regardless of which side the student was assigned. That is the whole point made mathematical: honest statistics do not move with advocacy. Students who shade get exposed on cross-examination. Students who hold the line reach the same posterior the evidence always supported.
Turnkey, classroom-ready.
- An admin-ready lesson plan. A fully editable plan with standards alignment, daily pacing, differentiation, and assessment, ready to adapt to your district template. Included with every purchase.
- 15-day playbooks. Minute-by-minute facilitation for every session, with evidence releases, cross-examination scripts, and full answer keys.
- A tech-enabled Workbook. A structured spreadsheet that computes the descriptive statistics, regression, and probability work so students interpret rather than recopy.
- Turnkey student files. Every exhibit, from the 34 Ridgeline invoices to the digital access logs and the amended lab report, ready to release on schedule.
- A dual rubric system. The 192-point Daily Journal and 24-point Final Reflection grade the quality of reasoning and intellectual honesty, not whether they win the case.
- The Teacher Guide. Daily objectives, the engineered pivots flagged in advance, and the facilitation moves that make students defend a reading.
Bring The Trial to your AP Statistics classroom.
Give your students a case where the honest analysis is the strong one, and watch them learn to defend the numbers under real pressure.
Get this simulationPreview real pages from the simulation before you spend a dollar. No guessing, no surprises.