The Trace
The instrument gave a clean number. The town was still getting sick. Both were true.
See what your students get, and why it lands.
No mockups. Every page below is real, pulled straight from the files you download. Tap any one to see it full size.
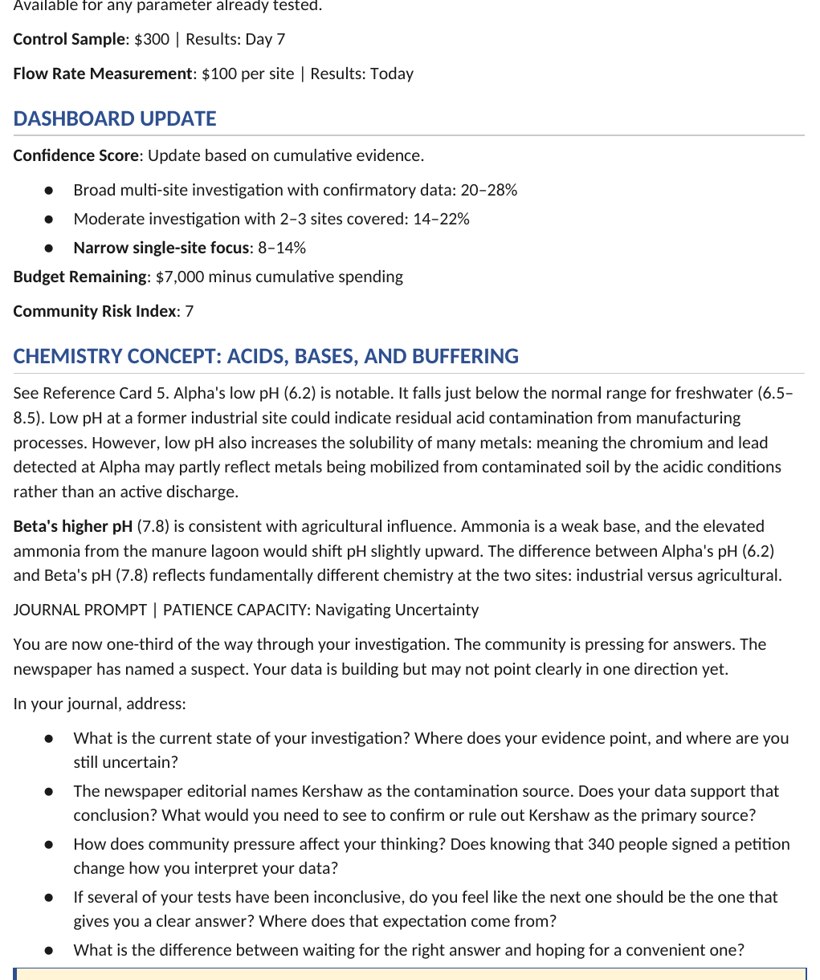
A worksheet was never going to teach this.
This is one daily data release, the document your students open at the start of a class period. They are the Lead Analyst at Clearwater Environmental Analytics, and Millhaven's water has people getting sick. They do not answer questions about water chemistry. They spend a finite seven thousand dollar budget deciding which tests to run at which of four sites, then read what comes back. A field instrument flags 128 ppb chromium at Kershaw Chemical. The newspaper already named the culprit. Your students have to decide whether that reading is worth chasing or worth confirming, knowing every test they buy is a test they cannot run somewhere else. The Community Risk Index climbs every day they take to choose.
Tap to see a daily data release
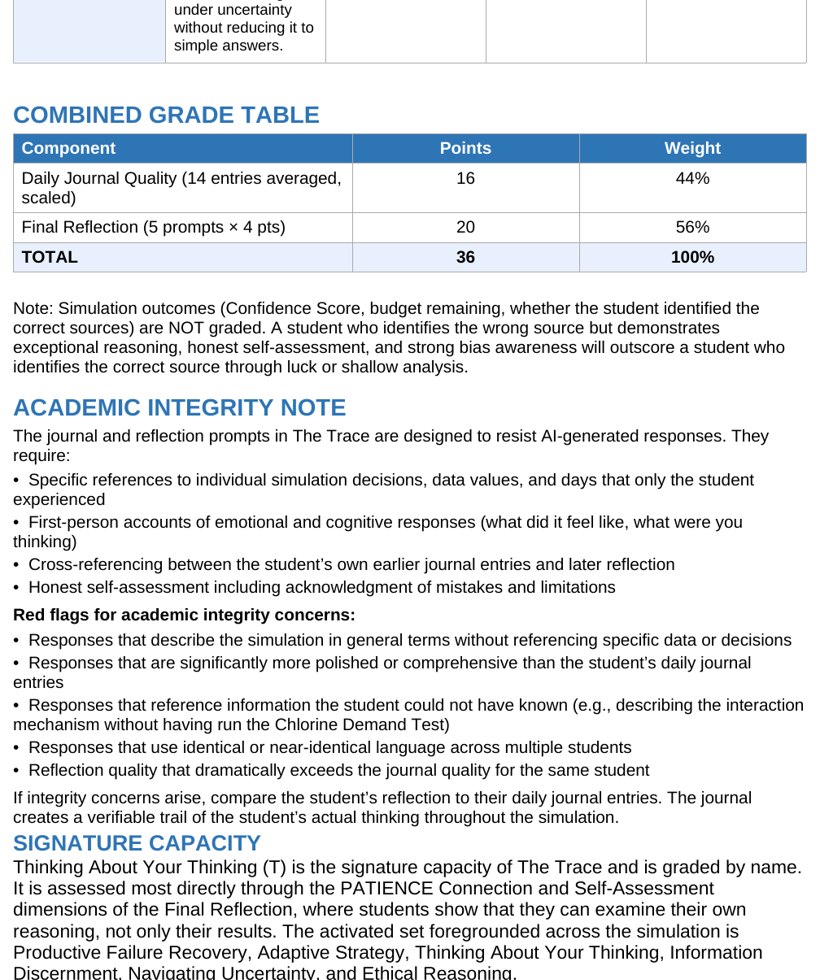
They are graded on the reasoning, not the result.
Here are the two rubrics you actually grade. A student who names the right source by luck scores below a student who names the wrong source but documents clean evidence-based reasoning, admits a bias, and adapts strategy. You read only two artifacts, the Daily Journal worth sixteen points and the Final Reflection worth twenty, on a fast holistic scale of zero, two, four, six. Remaining budget and confidence are never graded, so your students take real analytical risks instead of playing safe for points. Because the rubrics demand first-person accounts of specific decisions and the feelings behind them, the writing is very hard to fake with a chatbot. A class set moves quickly without losing rigor.
Tap to read the grading rubric
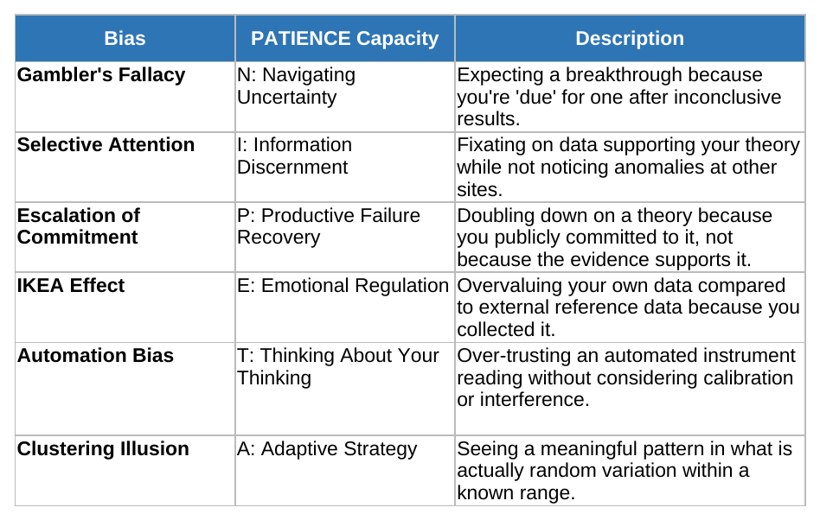
Let the workbook hold the busywork.
Every student gets the Student Workbook, an Excel file that runs the arithmetic so judgment gets the energy. It tracks the seven thousand dollar budget down to each test order, holds the data they have gathered across all four sites, and updates the confidence score that regulators want at seventy-five percent before any recommendation. When your students log a chromium result or a flow rate, the spreadsheet files it and shows what they can still afford. They are not maintaining a ledger by hand or recomputing a mass balance from scratch. They are looking at a live picture of an investigation and asking the only question that matters, which is what the data is actually telling them and what it is not. The formulas stay out of the way.
Tap to see the tracker
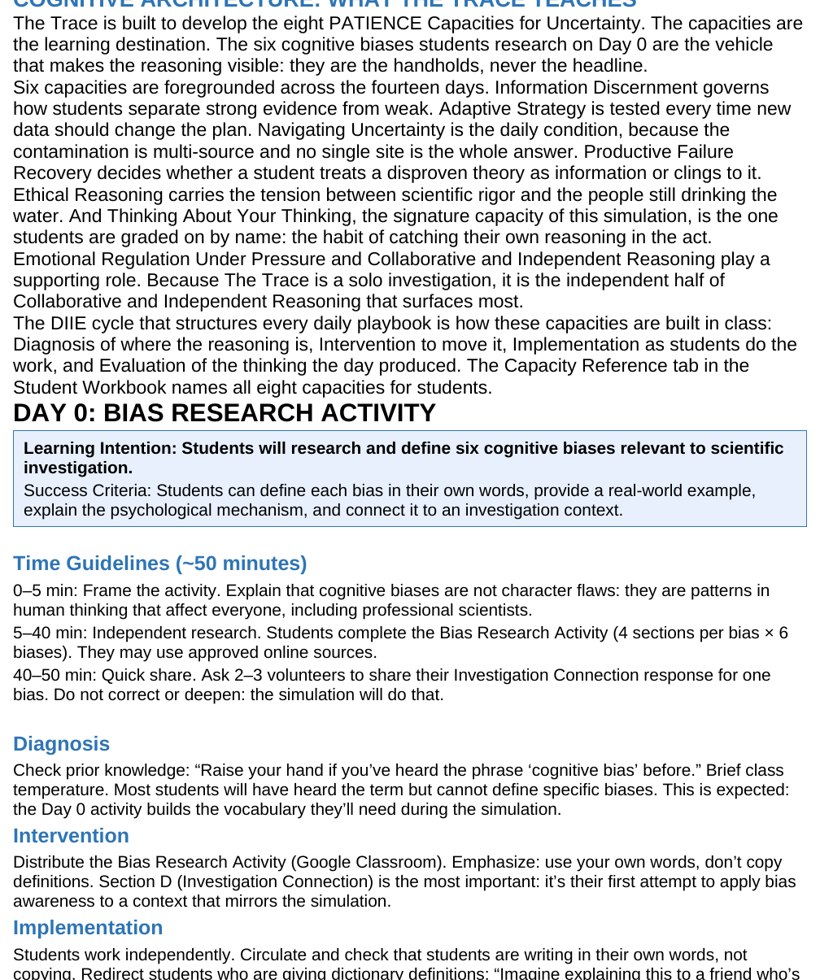
Every day is already scripted.
This is the Teacher Guide, and it scripts all fourteen sessions. Each class period comes with a Monday-Ready playbook, facilitation prompts, timing, redirect notes for the moment a table fixates on the wrong site, and a full chemistry answer key so you are never caught out by breakpoint chlorination or a karst arsenic baseline. You bring the facilitation and the questions that push reasoning. The simulation brings the case, the data, the keys, and the structure. Day 0 sets up the bias research and the setting, then the guide carries you through to the Day 14 council debrief. Your daily prep drops to reading the next play. You move from lecturer to expert guide, watching how your students think rather than managing logistics.
Tap to read the teacher guide
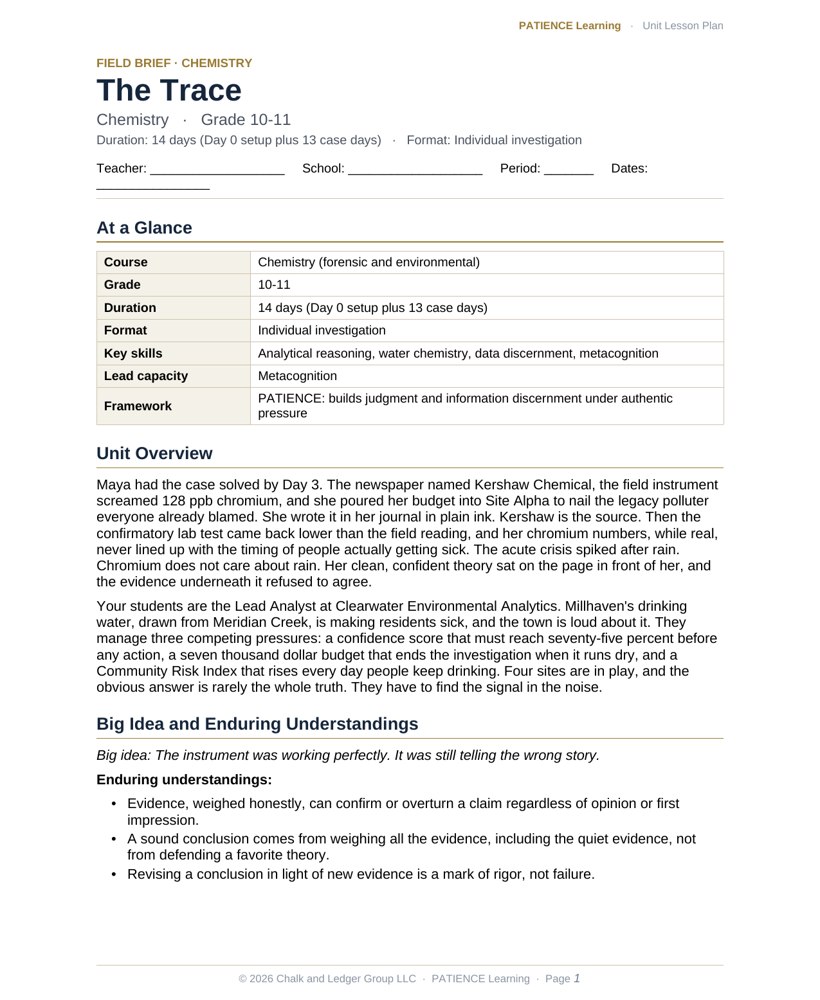
The lesson plan is already written.
Every simulation comes with a fully editable, admin-ready lesson plan. Standards alignment, daily pacing, learning objectives, differentiation, and an assessment plan are already done, so you can hand it to an administrator or adapt it to your district template in minutes.
Tap to preview the lesson plan
Close
Close
Close
Close
The day the obvious suspect stopped being the answer.
Maya had the case solved by Day 3. The newspaper named Kershaw Chemical, the field instrument screamed 128 ppb chromium, and she poured her budget into Site Alpha to nail the legacy polluter everyone already blamed. She wrote it in her journal in plain ink. Kershaw is the source. Then the confirmatory lab test came back lower than the field reading, and her chromium numbers, while real, never lined up with the timing of people actually getting sick. The acute crisis spiked after rain. Chromium does not care about rain. Her clean, confident theory sat on the page in front of her, and the evidence underneath it refused to agree.
She could defend the theory she had committed to, or she could trust the data. Maya went back to the boring tests she had skipped, the nutrient loads and flow rates at Holcomb Family Farms and the chlorine logs at the treatment plant. The ammonia surged after rain. The chlorine residual crashed at exactly those moments. Once she stopped protecting Kershaw, the real picture assembled itself, three sources interacting, not one villain. Fixing Alpha alone would not have saved Millhaven. She had been reading a name. Now she was reading the signal.
The Millhaven contamination crisis.
Your students are the Lead Analyst at Clearwater Environmental Analytics. Millhaven's drinking water, drawn from Meridian Creek, is making residents sick, and the town is loud about it. They manage three competing pressures: a confidence score that must reach seventy-five percent before any action, a seven thousand dollar budget that ends the investigation when it runs dry, and a Community Risk Index that rises every day people keep drinking. Four sites are in play, and the obvious answer is rarely the whole truth. They have to find the signal in the noise.
| Grade level | 10-11 |
| Course | Chemistry (forensic and environmental) |
| Duration | 14 days (Day 0 setup plus 13 case days) |
| Format | Individual investigation |
| Key skills | Analytical reasoning, water chemistry, data discernment, metacognition |
Engineering better thinkers.
In a crisis built from noisy, contradictory data, the careful read beats the confident guess. Each day pairs a named cognitive bias with the capacity that defeats it, so your students do not just learn water chemistry, they learn to catch their own shortcuts under real pressure.
| Bias targeted | The remedy, built into the work |
|---|---|
| Escalation of commitment | Productive failure recoveryStudents name a suspect in their journal, then meet evidence that breaks it. They learn to pivot off a committed theory at Site Alpha instead of defending it because they wrote it down. |
| Confirmation bias | MetacognitionWhen the newspaper and the field reading both point at Kershaw, students must watch their own thinking and ask what data would prove them wrong, not just what confirms the easy story. |
| Sunk cost fallacy | Adaptive strategyAfter spending on the wrong site, students decide whether to keep funding a dying theory or redirect the remaining budget. The score rewards the redirect, never the stubborn defense. |
| Automation bias | Information discernmentA field instrument reads 128 ppb chromium. Students learn that a working machine can mislead in a real water matrix, and that a confirmatory lab test is worth its cost. |
| Clustering illusion | Navigating uncertaintyArsenic readings of 11 to 13 ppb look like a trend. Students learn to separate that from the karst limestone's natural 8 to 15 ppb baseline and not chase a red herring. |
| IKEA effect | Emotional regulationOn Day 9, students compare their own hard-won data against EPA reference results. They learn to value data by methodological rigor, not by who collected it, even when it is theirs. |
14 days of evidence under pressure.
Day 0 builds the foundation, bias research and the setting profile, before any data moves. Then the case unfolds through a deliberate sequence so your students hit the contradiction with budget and time still on the table. They establish a baseline, chase the obvious suspect, fail productively, and rebuild toward a multi-source truth that no single site explains.
| Day | What lands | Capacity in focus |
|---|---|---|
| 0 | Bias research activity and setting profile load | Metacognition |
| 1 | Test allocation across four sites; baseline panels or a costly bet | Adaptive strategy |
| 3 | The 128 ppb chromium reading; confirm it or chase it (critical pivot) | Information discernment |
| 5 | Site Alpha data thickens; the legacy suspect looks settled | Confirmation bias awareness |
| 6 | Flow rate and baseline metals close out; skipped tests come due | Productive failure recovery |
| 8 | Holcomb Farms nutrient loads surface after rain events | Navigating uncertainty |
| 9 | Own data meets EPA reference set; integrate or defend | Emotional regulation |
| 10 | Chlorine logs show six crashes tied to rainfall; breakpoint chlorination revealed (critical pivot) | Productive failure recovery |
| 12 | Multi-source interaction confirmed; confidence climbs past 75 percent | Adaptive strategy |
| 14 | Town council debrief and final reflection | Metacognition |
Standards alignment.
The Trace targets HS chemistry under NGSS. Students plan and carry out investigations and analyze data to support claims (Science and Engineering Practices SEP-3 and SEP-4), and reason about reactions and concentration. The breakpoint chlorination core connects to HS-PS1-2, predicting outcomes of chemical reactions based on patterns, as ammonia consumes free chlorine. Tracking ppb concentrations, mass balance, and flow rates draws on HS-PS1-7 quantitative reasoning. The Millhaven crisis maps to HS-ESS3-4 on managing human impacts on water systems. Throughout, students engage in argument from evidence (SEP-7) and evaluate the reliability of sources and instruments.
The hidden architecture.
The pivot is engineered. Day 3 hands students a dramatic 128 ppb field chromium reading at the site the newspaper already blamed, baiting automation bias and confirmation bias into a full commitment to Kershaw. Chromium is a real chronic contributor, so the bait is not a lie, just a partial truth that cannot explain an acute, rain-triggered crisis. The true mechanism is breakpoint chlorination: ammonia from Holcomb Farms surges after rain and consumes the treatment plant's already low chlorine residual. Only students who ran the boring early tests, nutrient loads and flow rates, have the data to order the Day 10 Chlorine Demand Test and prove the interaction. The design rewards methodical preparation by making the epiphany unreachable without it. Biases lead straight to the wrong single villain; only evidence assembles the multi-source truth.
Turnkey, classroom-ready.
- An admin-ready lesson plan. A fully editable plan with standards alignment, daily pacing, differentiation, and assessment, ready to adapt to your district template. Included with every purchase.
- 14-day playbooks. Minute-by-minute facilitation for every session, with timing, redirect notes, and full chemistry answer keys.
- A tech-enabled Student Workbook. An Excel file that runs the budget, mass balance, and confidence formulas so judgment gets the energy.
- Daily data releases. One release document per class period, the evidence your students actually decide from.
- Turnkey student files. A Day 0 bias research activity and setting profile, ready to post to your LMS.
- A dual rubric system. Grades the quality of reasoning, not whether they solve it, on a fast holistic scale.
Put your students in the analyst's chair.
Bring The Trace to your chemistry classroom and let your students learn to trust evidence over the obvious answer, one disciplined decision at a time.
Get this simulationPreview real pages from the simulation before you spend a dollar. No guessing, no surprises.