The Redline
Calculus stops being the punishment for a wrong worksheet answer and becomes the tool your students use to decide.
See what your students get, and why it lands.
No mockups. Every page below is real, pulled straight from the files you download. Tap any one to see it full size.
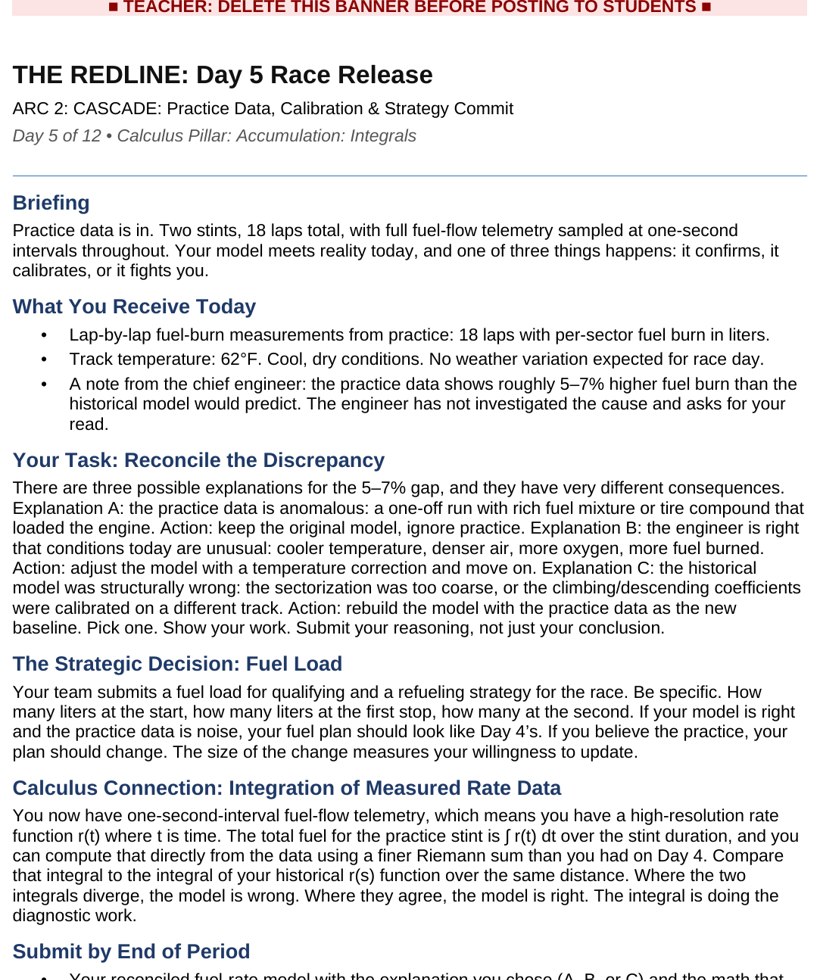
Your students are not answering questions. They are making a call from the evidence.
This is one daily release from inside the Nexus IndyCar season. The team has telemetry, a tire that is losing grip, and a strategic question with money on it: pit at lap 18 or lap 26? There is no answer key in the room. Your students read the data, build a rate-of-change model, and commit to a window they have to defend later in a Post-Race Report. The derivative is not an exercise here. It is the thing standing between a sound pit call and a blown race. When the work feels like a real job instead of a problem set, students stop asking whether it will be on the test and start asking whether their model holds.
Tap to see a daily case release
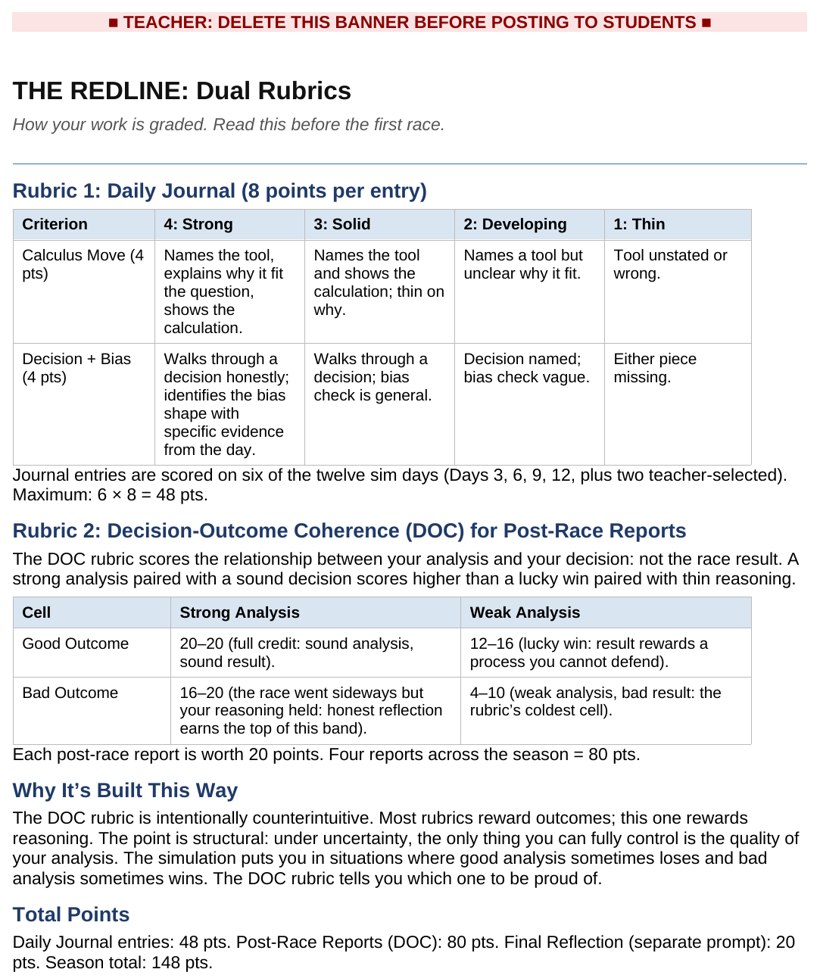
They are graded on their reasoning, not on whether the race went their way.
This is the Decision-Outcome Coherence rubric, and it is built to defeat luck. In a real analytics shop a team can make a flawless call and still lose to a random anomaly, and a team can win on a guess. The DOC rubric scores the first as a success and the second as a failure of rigor. Across 148 points, daily individual journals carry 48 points for documented assumptions and metacognition, four Post-Race Team Reports carry 80 points for model accuracy, decision logic, and bias recognition, and a final reflection carries 20. A sound process behind a wrong pit call beats a lucky win every time. Reasoning is the grade.
Tap to read the grading rubric
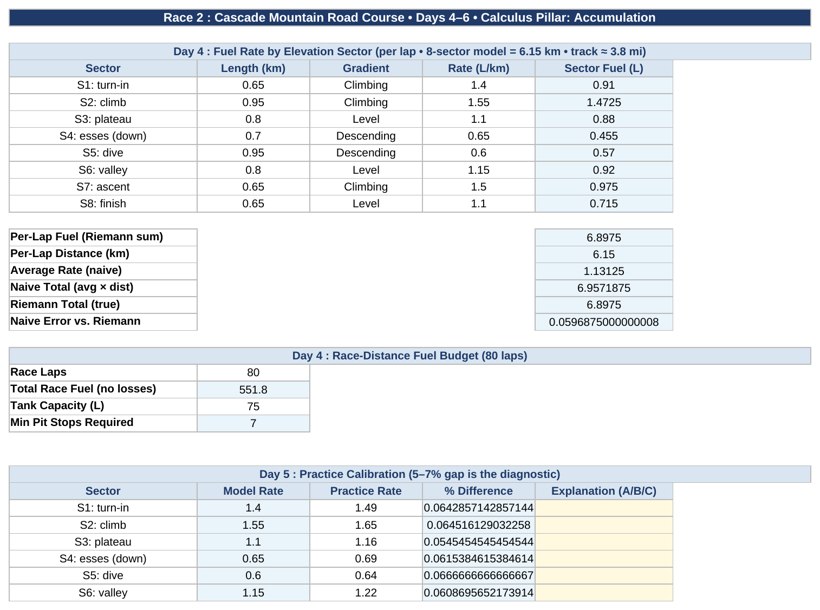
Let the workbook hold the busywork so the energy goes to judgment.
This is the automated Excel workbook your students drive all season. It is a professional-grade environment for telemetry analysis, residual logging, and sensitivity diagnostics. Students enter data and the workbook handles the arithmetic of difference quotients, Riemann sums, and the bookkeeping that would otherwise eat a class period. That is deliberate. When the spreadsheet carries the computation, the human in the seat is free to ask the questions that actually matter: does this model trust its own inputs, is the degradation curve really accelerating, is a four-decimal coefficient honest given the data behind it. The tool does the grinding so your students spend their thinking on the decision.
Tap to see the tracker
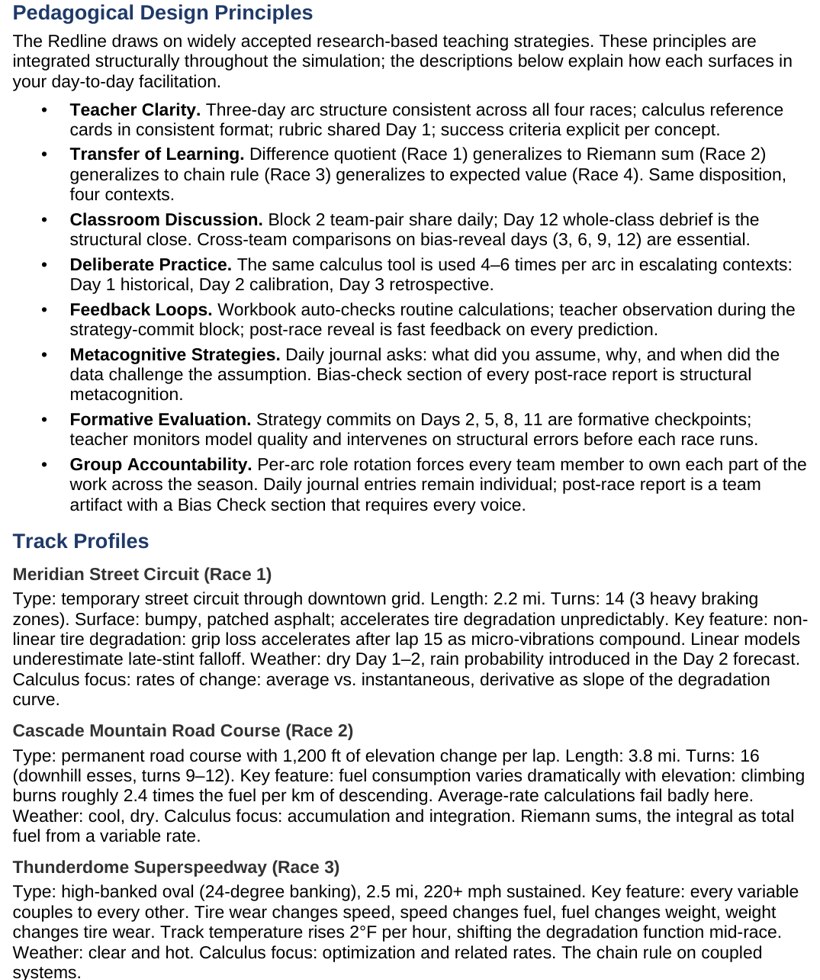
Every day is already scripted. You bring the facilitation, the simulation brings everything else.
This is the Playbook, the 15-day teacher guide. Every session has a daily concept lesson and minute-by-minute facilitation notes, so you walk in knowing exactly how the period runs and where the day turns. The guide tells you when to release the practice data, when to hold the line during an Anomaly Envelope, and when to spring the Reveal that names the bias your students just fell into. You do not need to be a racing expert or rebuild a single lesson. The hard design work, the planted contradictions, the pivot points, the answer keys, is already done. You bring the questions and the room. Prep stays light.
Tap to read the teacher guide
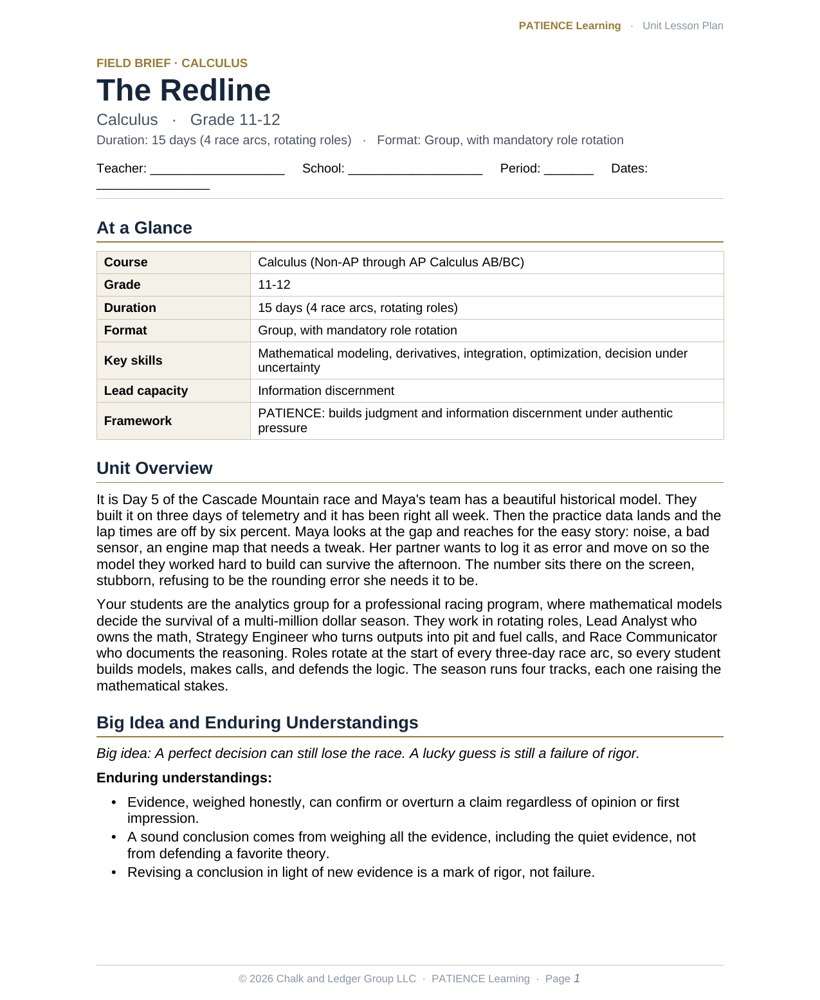
The lesson plan is already written.
Every simulation comes with a fully editable, admin-ready lesson plan. Standards alignment, daily pacing, learning objectives, differentiation, and an assessment plan are already done, so you can hand it to an administrator or adapt it to your district template in minutes.
Tap to preview the lesson plan
Close
Close
Close
Close
The moment the favored model meets the data it cannot explain.
It is Day 5 of the Cascade Mountain race and Maya's team has a beautiful historical model. They built it on three days of telemetry and it has been right all week. Then the practice data lands and the lap times are off by six percent. Maya looks at the gap and reaches for the easy story: noise, a bad sensor, an engine map that needs a tweak. Her partner wants to log it as error and move on so the model they worked hard to build can survive the afternoon. The number sits there on the screen, stubborn, refusing to be the rounding error she needs it to be.
This is the pivot. Maya can protect the model she is proud of, or she can treat the six percent as the truth telling her something. She stops, reruns the accumulation over the elevation change, and watches her average-rate assumption fall apart on the climb. The historical model was never wrong about the past. It was wrong about this mountain. Once she trusts the gap instead of explaining it away, the integration she was avoiding becomes the only honest way to compute the fuel, and the real strategy finally comes into focus.
The performance-analytics group for a Nexus IndyCar team.
Your students are the analytics group for a professional racing program, where mathematical models decide the survival of a multi-million dollar season. They work in rotating roles, Lead Analyst who owns the math, Strategy Engineer who turns outputs into pit and fuel calls, and Race Communicator who documents the reasoning. Roles rotate at the start of every three-day race arc, so every student builds models, makes calls, and defends the logic. The season runs four tracks, each one raising the mathematical stakes.
| Grade level | 11-12 |
| Course | Calculus (Non-AP through AP Calculus AB/BC) |
| Duration | 15 days (4 race arcs, rotating roles) |
| Format | Group, with mandatory role rotation |
| Key skills | Mathematical modeling, derivatives, integration, optimization, decision under uncertainty |
Engineering better thinkers.
In a pit box the cost of a biased model is a lost race, so discernment is not optional. The Redline names a bias for each arc and pairs it with the capacity that defeats it, then withholds the label until students have already felt the trap in their own work.
| Bias targeted | The remedy, built into the work |
|---|---|
| Anchoring | Productive failure recoveryDay 2 invites a token one-lap tweak instead of a full update to new telemetry. Students who anchor watch their pit window miss, then rebuild from the current data rather than the comfortable first number. |
| Confirmation bias | MetacognitionThe five to seven percent practice gap on Day 5 begs to be dismissed as noise. Students must catch themselves protecting a pre-built model and ask whether the data, not the theory, is the thing to trust. |
| Sunk cost fallacy | Adaptive strategyA historical model that cost three days of work tempts teams to keep it on a track where it no longer fits. Students learn to abandon a sunk investment when the mountain changes the math. |
| Availability bias | Information discernmentRecent high-speed Thunderdome data is vivid and easy to reach for when modeling the slower Pacific street sections. Students weigh which evidence actually fits the conditions in front of them. |
| Tunnel vision | Navigating uncertaintySingle-point pit-lap estimates feel decisive but hide the risk in a coupled system. Students replace false certainty with honest uncertainty ranges that survive a temperature spike. |
| Overconfidence | Emotional regulationThe eight-minute anomaly window rewards the urge to do something. Students regulate the impulse to over-correct and hold the line when the math says holding is the right call. |
15 days of evidence, models, and decisions.
The season moves through four track profiles, shifting the cognitive load from simple rates to coupled systems under uncertainty. Each three-day arc opens with a setup day, hits its pivot mid-arc, and closes with a Post-Race Report and a Reveal that names the bias the team just lived through.
| Day | What lands | Skill in focus |
|---|---|---|
| 1 | Meridian Street Circuit opens; roles assigned, first telemetry released | Rates of change, derivatives |
| 2 | The anchoring trap: a token one-lap tweak versus a full update to new data (critical pivot) | Productive failure recovery |
| 3 | First pit window committed and defended; Post-Race Report and Reveal | Defending a model |
| 4 | Cascade Mountain opens; roles rotate; accumulation over elevation | Integration |
| 5 | The practice gap of five to seven percent appears and demands a verdict (critical pivot) | Confirmation bias, metacognition |
| 6 | Fuel recomputed over the 1,200 ft climb; report and Reveal | Adaptive strategy |
| 7 | Thunderdome Oval opens; roles rotate; coupled rates | Optimization, related rates |
| 8 | A 3 degree temperature spike couples fuel, speed, and weight in an anomaly window | Navigating uncertainty |
| 9 | Optimized pace committed; report and Reveal | Emotional regulation |
| 10 | Pacific Grand Prix opens; roles rotate; modeling under a 20 percent rain forecast | Probability-weighted decisions |
| 11 | Recency bias tempts over-weighting of Thunderdome data on the street sections | Information discernment |
| 12 | Expected-value strategy committed; final Post-Race Report and Reveal | Decision under uncertainty |
| 13 | Final reflection on analytical disposition and failure modes | Metacognition |
Standards alignment.
The Redline carries a crosswalk for AP Calculus AB and BC and the CCSS-M Standards for Mathematical Practice, anchored on MP.4, model with mathematics, and supported by MP.1, MP.3, MP.5, and MP.6. The four arcs hit derivatives and rates of change, definite integrals and accumulation, optimization and related rates, and modeling under uncertainty. The simulation flexes by depth of derivation. A non-AP class can reach a pit window through discrete numerical reasoning, while an AP BC class can use parametric and vector hooks to model velocity and trajectory. The same case serves the top STEM track and a standard section without a content swap.
The hidden architecture.
The engine of The Redline is the Discovery-First Reveal. Students study six biases early, but the bias driving each arc is never named until the end of the class that exposes it. The contradictions are planted on purpose. Day 2 dangles a token adjustment so anchoring can bite. Day 5 plants a five to seven percent gap that looks exactly like noise, so a team that loves its historical model will dismiss the very data that should break it. The eight-minute anomaly window rewards action when the math says hold. Each trap is engineered so students feel the failure in their own logic first, and only then receive the vocabulary to fix it. The emotional payoff is the lesson, so the structural delay is doing real work.
Turnkey, classroom-ready.
- An admin-ready lesson plan. A fully editable plan with standards alignment, daily pacing, differentiation, and assessment, ready to adapt to your district template. Included with every purchase.
- The Playbook. A 15-day teacher guide with daily concept lessons and minute-by-minute facilitation notes for every session.
- An automated Excel workbook. A professional-grade environment for telemetry analysis, residual logging, and sensitivity diagnostics that carries the computation.
- Anomaly Envelopes. Randomized mid-race challenges, caution flags and temperature spikes, that force teams to apply the chain rule under eight-minute time pressure.
- Daily Releases. Ready-to-print practice data, race results, and the crucial Reveal answer keys, sequenced for every day.
- A dual rubric system. The Decision-Outcome Coherence rubric grades the quality of reasoning across 148 points, not whether the race went the team's way.
Hand your students a real decision, not another worksheet.
Bring The Redline to your Calculus room and watch your students learn to trust the evidence, name their own biases, and decide like adults.
Get this simulationPreview real pages from the simulation before you spend a dollar. No guessing, no surprises.