The Projection
The first number you land on is not the right one. The data is.
The first number you land on is not the right one. The data is.
The Projection makes your eighth graders the analyst behind a business plan, building a sales forecast from real data. Over ten days an early guess anchors them, a compelling story tempts them, and the actual numbers keep asking for a revision. The students who update their projection when the data changes build a forecast that holds. It is modeling with honesty built in.
See what your students get, and why it lands.
No mockups. Every page below is real, pulled straight from the files you download. Tap any one to see it full size.
A worksheet was never going to teach this.
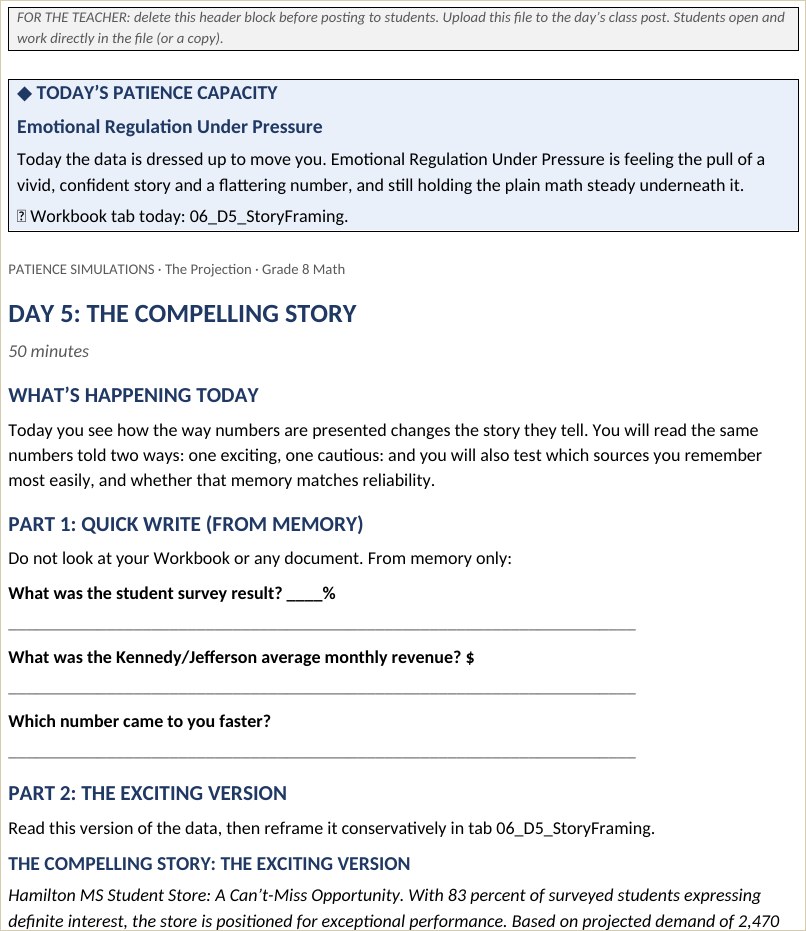
Your eighth graders are not plotting points from a textbook table. They are an analyst forecasting sales, and a compelling story about a big launch pulls the number up while the data says something calmer. The first figure they wrote down wants to stick. The analysts who let the evidence move their projection, even when it means admitting the first guess was high, build a forecast that survives. That is data modeling, with a real plan riding on it.
Tap to read the compelling story
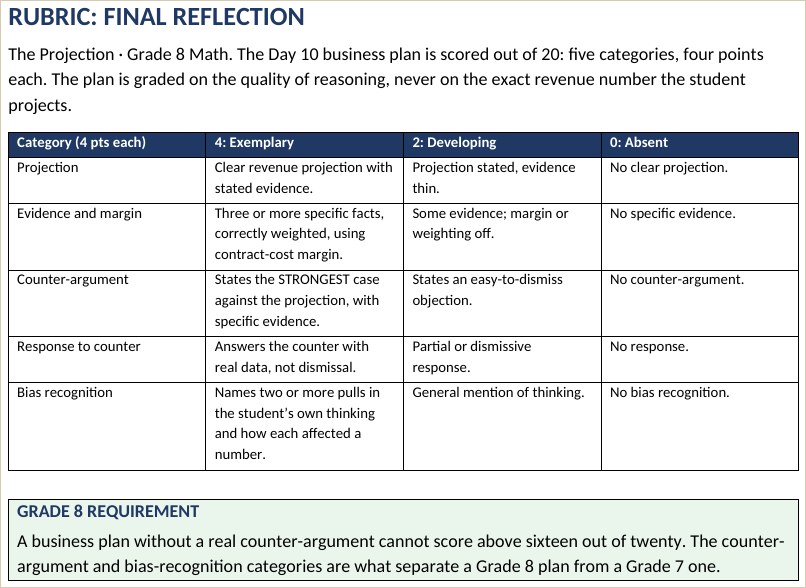
They are graded on their reasoning, not on the projection.
Here is what surprises teachers. A student whose projection matched the intended one is not graded higher than one whose did not. The number is not the point. Students are assessed on the quality of their reasoning, traced through their own daily journal. A forecast that changed honestly with the data scores higher than a lucky guess that never moved. That is how an eighth grader learns the courage to revise a number when the evidence dictates.
Tap to read the grading note
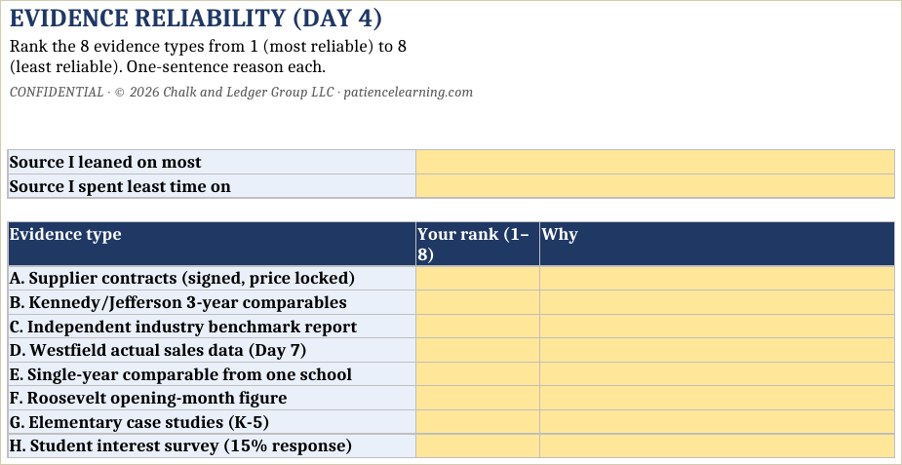
Let the workbook handle the math.
No eighth grader should lose the lesson because the projection math got away from them. The Projection comes with a workbook that builds the forecast from the data as the analyst enters each figure. The model recalculates on its own. Their attention stays on the real question, what the data actually supports, instead of on the arithmetic.
Tap to see the projection model
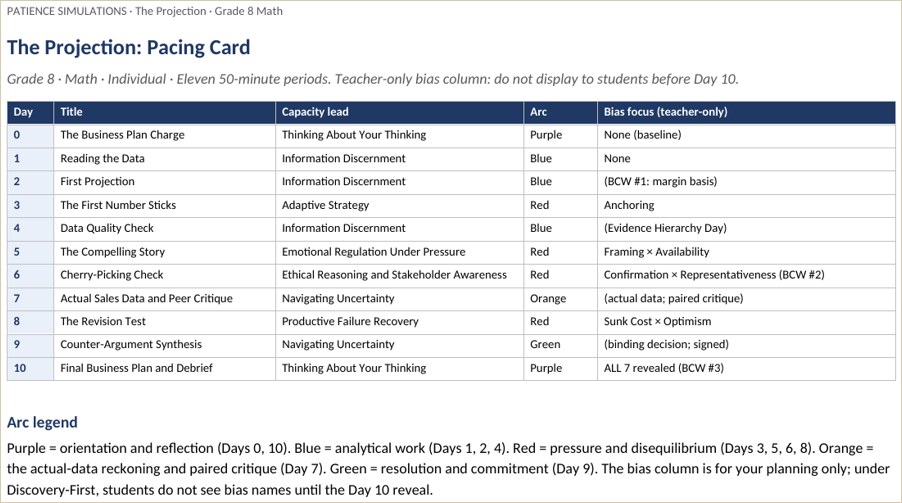
Every day is already scripted. You just run the room.
You do not need a finance or modeling background to teach this. The guide scripts every day, names what students will likely say, and gives you exactly how to respond. The data, the story, the actual sales, and the final plan are all written for you. You bring the facilitation. The simulation brings everything else.
Tap to read the teacher guide
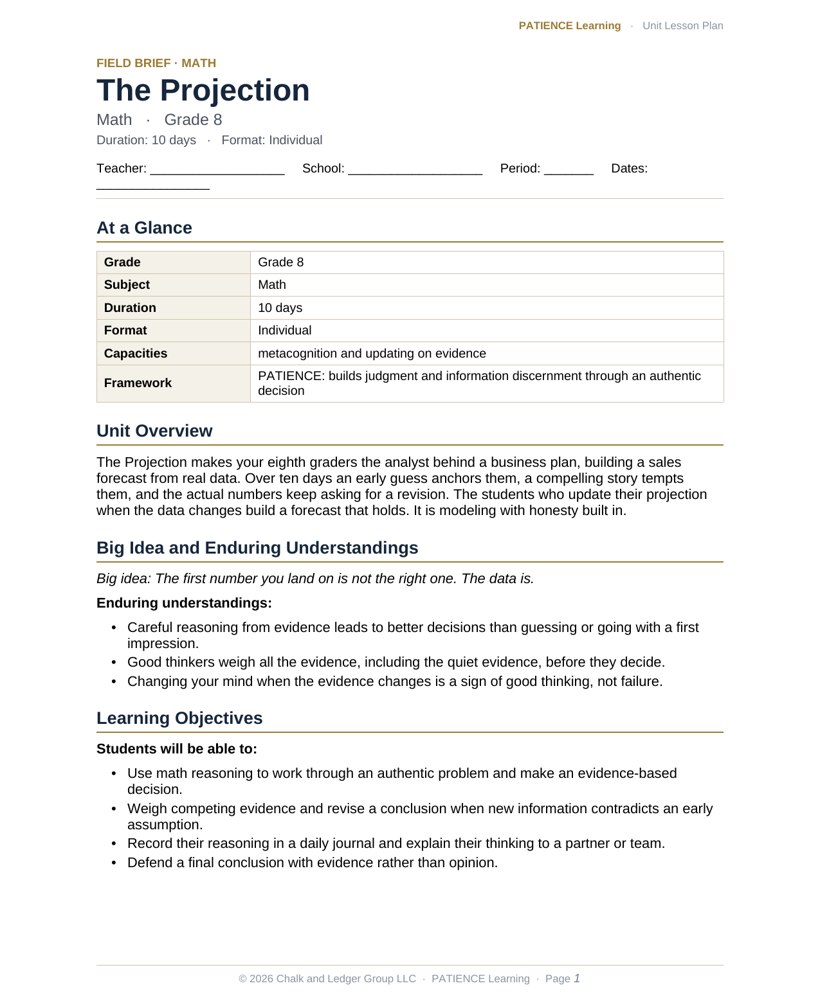
The lesson plan is already written.
Every simulation comes with a fully editable, admin-ready lesson plan. Standards alignment, daily pacing, learning objectives, differentiation, and an assessment plan are already done, so you can hand it to an administrator or adapt it to your district template in minutes.
Tap to preview the lesson plan
Close
Close
Close
Close
Everything you need to run it.
- An admin-ready lesson plan. A fully editable plan with standards alignment, daily pacing, differentiation, and assessment, ready to adapt to your district template. Included with every purchase.
- Eleven days of playbooks (Day 0 plus ten) that script every session.
- A student workbook that builds the projection straight from the data.
- Business data, a compelling pitch, and the actual sales that test the forecast.
- Daily journals and a rubric that grade reasoning, not the projection.
- Scaffolded student files for the early days, for learners who need more support.
- Built on the PATIENCE framework: metacognition and updating on evidence.
Bring The Projection to your classroom.
Ten days, fully planned, and a forecast that has to follow the data.
Get this simulationPreview real pages from the simulation before you spend a dollar. No guessing, no surprises.