The Habitat
The boring choice builds soil. The flashy choice plants seedlings that die on Day 8.
See what your students get, and why it lands.
No mockups. Every page below is real, pulled straight from the files you download. Tap any one to see it full size.
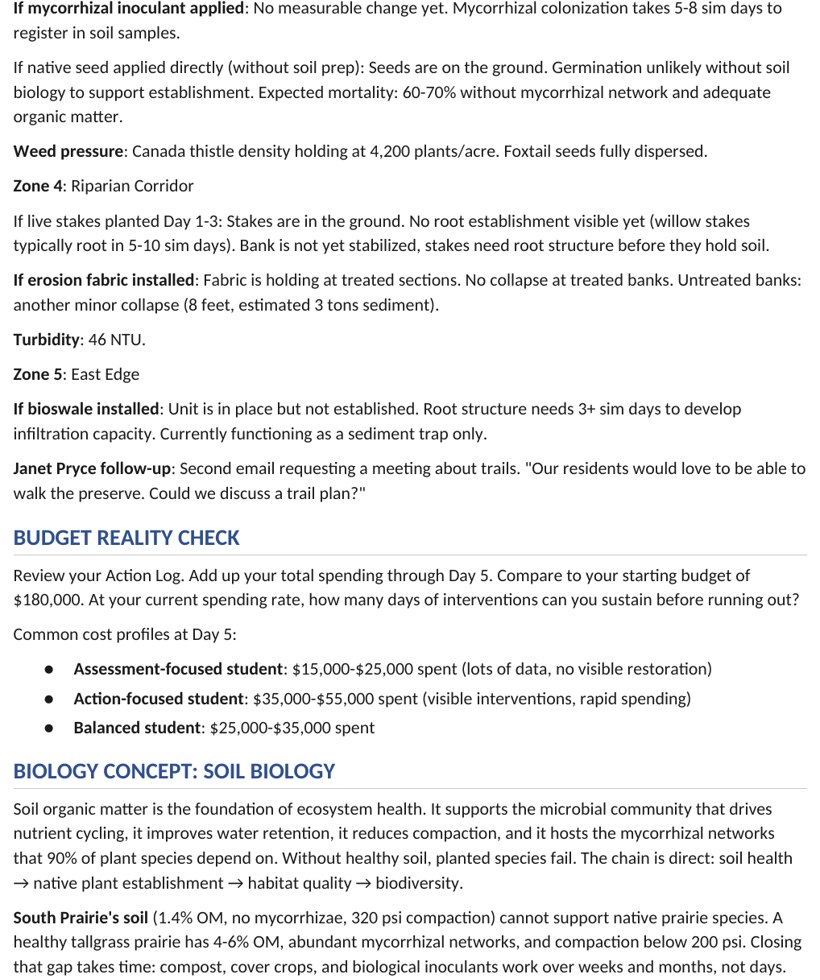
Your students are not answering questions. They are spending a real budget.
On a case day, your students open the day's data release and read the Restoration Dashboard for Blackwater Nature Preserve. Biodiversity, soil health, water quality, and invasive coverage have all moved since their last call, and not always the way they hoped. They have $180,000 for the whole season and only two interventions to make today. North Forest honeysuckle is killing the canopy. The South Prairie soil is dead and needs invisible work before anything will grow. They cannot do both. A worksheet asks for the answer that is already in the back of the book. This asks your students to weigh urgency against foundation, commit capital, and live with a 2-3 day lag before the data tells them whether they were right.
Tap to see a daily data release
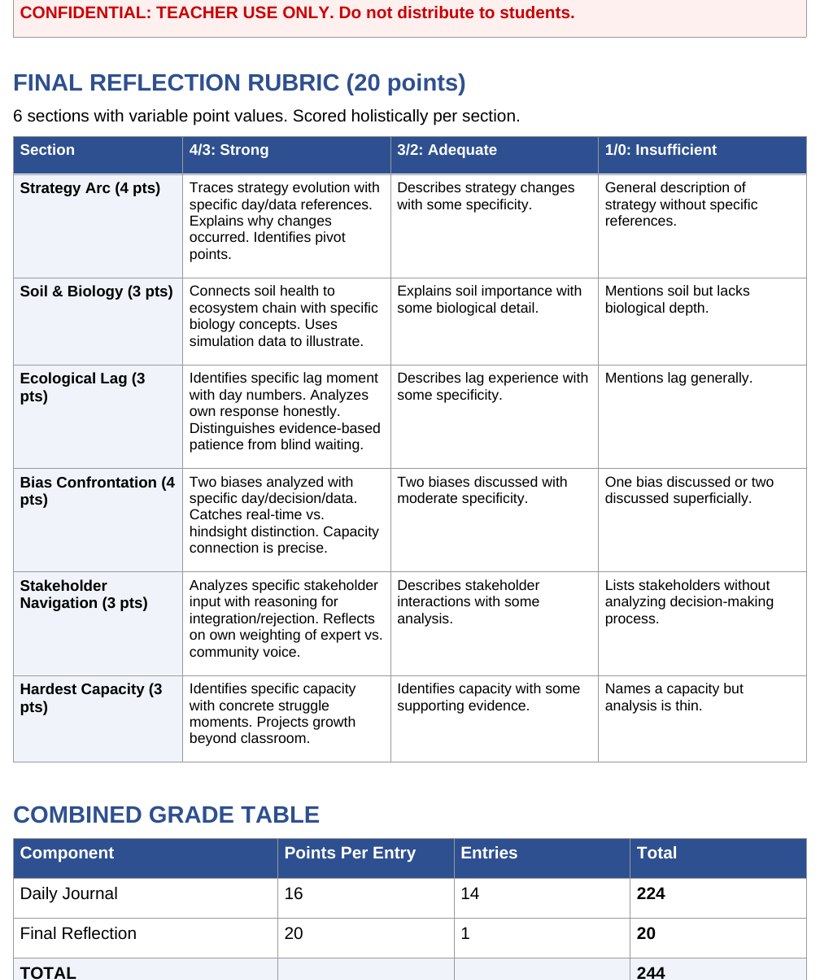
A student who loses half the preserve can outscore one who got lucky.
The Habitat ships with dual rubrics. One looks at the preserve. The other, the one that matters, looks at the thinking. A student whose riparian corridor was wrecked by the Day 10 storm but who traces a clear, data-led case for every decision will outscore a student who hit pretty dashboard numbers by accident. The reasoning rubric is blunt about it: generic responses that could apply to any student do not meet the standard. To earn the marks, your students must cite specific day numbers and dashboard trends to justify what they did. That makes the work theirs. It also makes it AI-resistant, because the reasoning hangs on unique data points and personal pivots no model can invent.
Tap to read the grading rubric
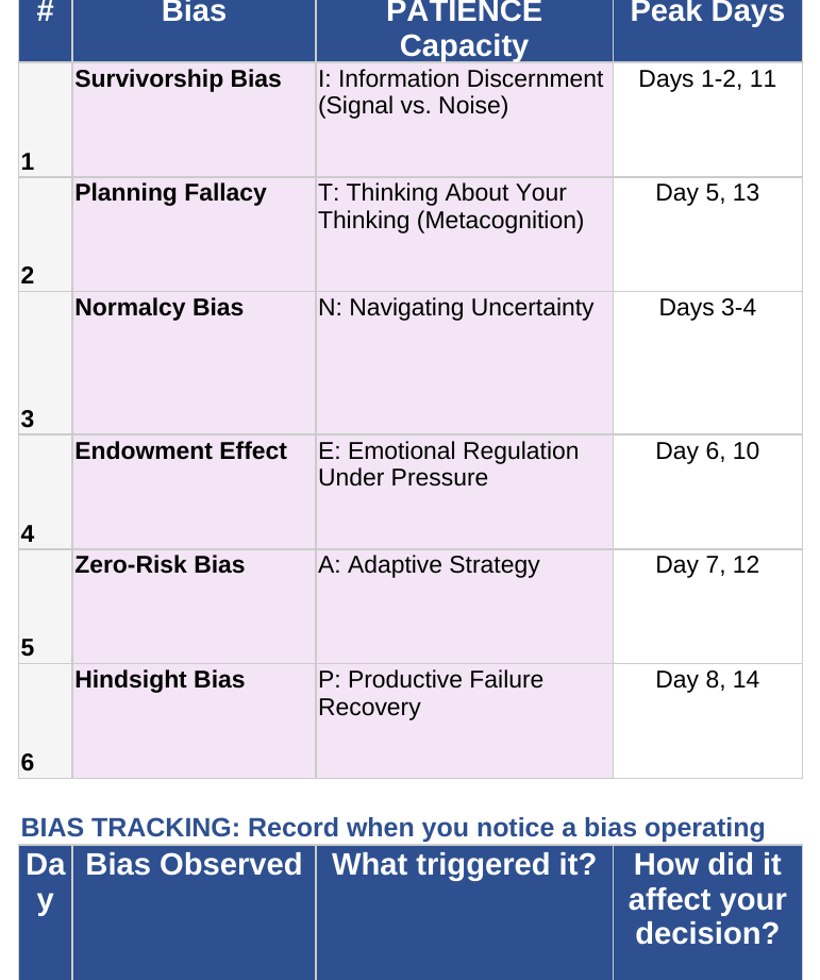
Let the workbook hold the budget so your students can hold the judgment.
Each student gets an Excel-based workbook with an automated budget tracker built in. It subtracts every intervention from the $180,000, flags when a zone is running them dry, and charts the four dashboard metrics across the season so trends are visible at a glance. Your students are not doing arithmetic or redrawing graphs by hand. The tool carries that load. What it cannot do is decide whether to spend $45,000 chasing 100 percent eradication in one zone while four others slide. That is the work you want their energy on. The numbers stay honest and current on screen, so the conversation in the room stays on strategy, evidence, and the trade-off in front of them.
Tap to see the tracker
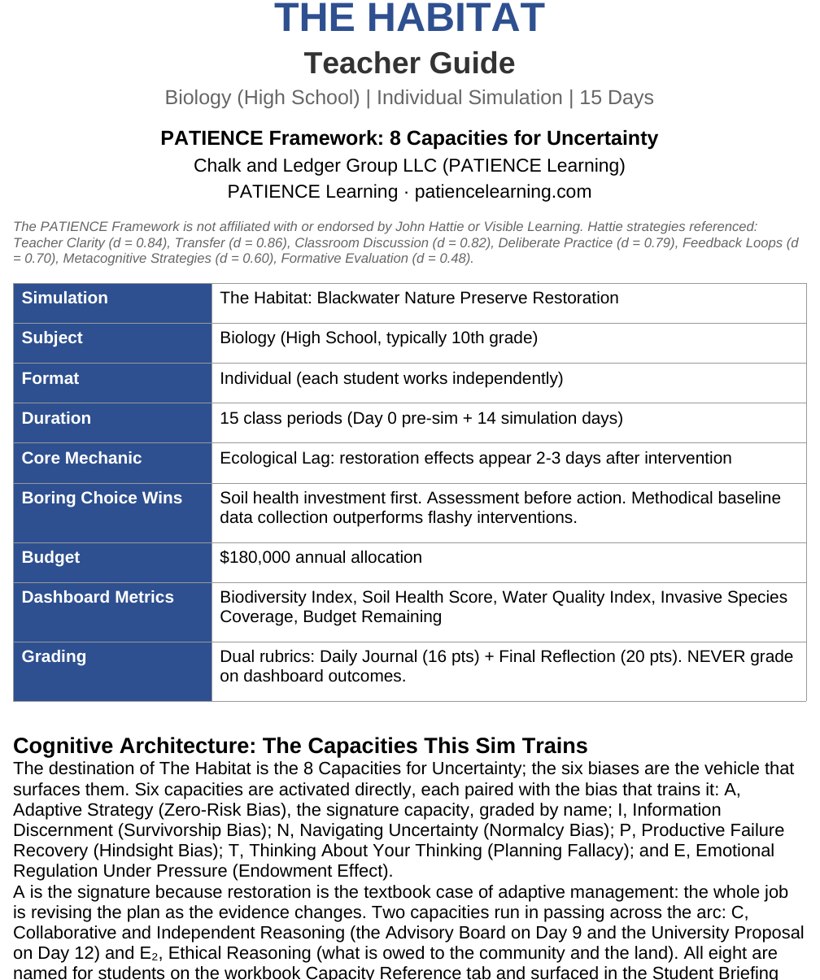
Every one of the 15 days is already scripted. You bring the facilitation.
The Habitat includes 15 daily teacher playbooks, one per session. Each scripts the day from open to close: what data drops, which bias is in play, the timing of each segment, and the debriefing questions that pull the lesson to the surface. The Day 8 script knows the Soil Builders are about to overtake the Flashy Planters and tells you how to run that reveal. The Day 10 storm script tells you how to hold the room when work gets destroyed. You are not building lessons at midnight or guessing what to ask. You bring the facilitation and the read of your students. The simulation brings the data, the structure, and the questions. Prep stays light.
Tap to read the teacher guide
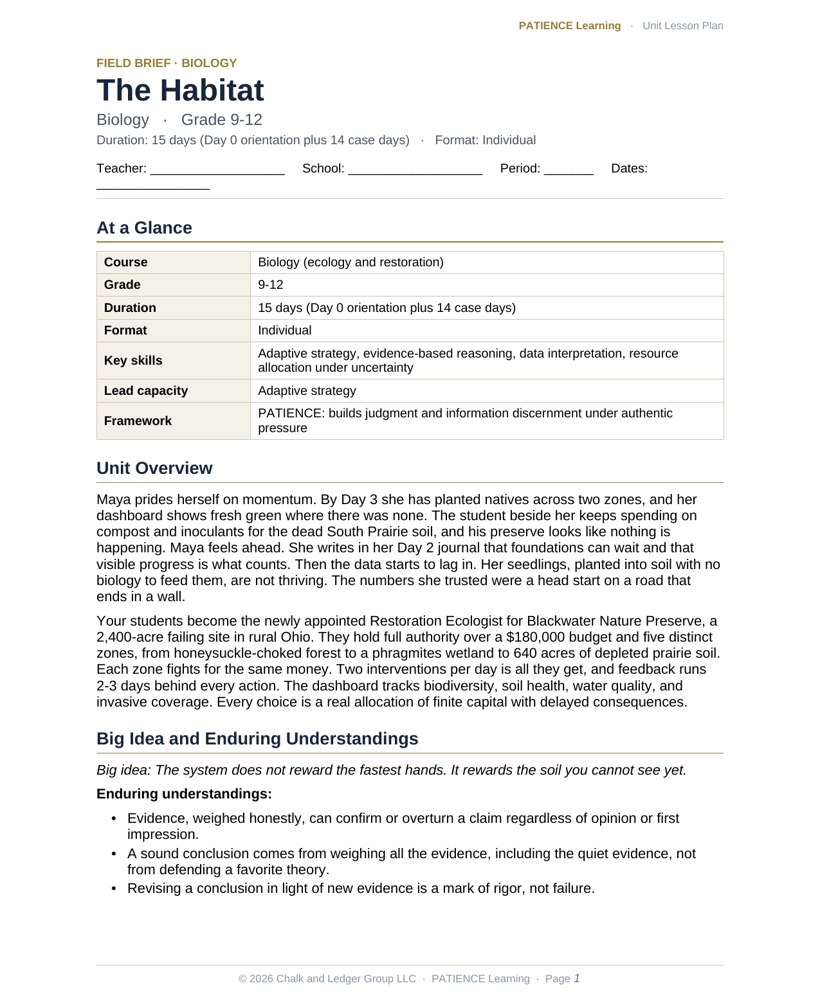
The lesson plan is already written.
Every simulation comes with a fully editable, admin-ready lesson plan. Standards alignment, daily pacing, learning objectives, differentiation, and an assessment plan are already done, so you can hand it to an administrator or adapt it to your district template in minutes.
Tap to preview the lesson plan
Close
Close
Close
Close
The week the soil work was invisible, and the week it stopped being invisible.
Maya prides herself on momentum. By Day 3 she has planted natives across two zones, and her dashboard shows fresh green where there was none. The student beside her keeps spending on compost and inoculants for the dead South Prairie soil, and his preserve looks like nothing is happening. Maya feels ahead. She writes in her Day 2 journal that foundations can wait and that visible progress is what counts. Then the data starts to lag in. Her seedlings, planted into soil with no biology to feed them, are not thriving. The numbers she trusted were a head start on a road that ends in a wall.
Day 8 is the lag resolution. The slow, methodical soil work finally lands, and the boring choice next to her overtakes her in biodiversity while her own seedlings die back. Maya has a decision. She can protect her story, the one where she was right to plant first, or she can read what the dashboard is actually telling her. She rereads her own Day 2 journal and sees she chose flash over foundation in her own words. When she chooses the evidence over the story, the wall turns into a map. She rebuilds soil-first, and for the first time her plan matches how the system actually works.
Blackwater Nature Preserve, 2,400 acres, and a budget that will not stretch.
Your students become the newly appointed Restoration Ecologist for Blackwater Nature Preserve, a 2,400-acre failing site in rural Ohio. They hold full authority over a $180,000 budget and five distinct zones, from honeysuckle-choked forest to a phragmites wetland to 640 acres of depleted prairie soil. Each zone fights for the same money. Two interventions per day is all they get, and feedback runs 2-3 days behind every action. The dashboard tracks biodiversity, soil health, water quality, and invasive coverage. Every choice is a real allocation of finite capital with delayed consequences.
| Grade level | 9-12 |
| Course | Biology (ecology and restoration) |
| Duration | 15 days (Day 0 orientation plus 14 case days) |
| Format | Individual |
| Key skills | Adaptive strategy, evidence-based reasoning, data interpretation, resource allocation under uncertainty |
Engineering better thinkers.
Restoration is the textbook case of adaptive management, where the right answer changes as the data comes in. Discernment decides whether your students read the ecosystem or their own hopes. Each day pairs a specific bias with the capacity that defeats it, so the trap and the remedy arrive together.
| Bias targeted | The remedy, built into the work |
|---|---|
| Survivorship bias | Information discernmentThe reference cards show three restoration success stories. Students must notice what those cases leave out, the failed projects nobody wrote up, before copying a strategy that only worked once. |
| Planning fallacy | MetacognitionBank stabilization costs more and takes longer than the Day 1 estimate. Students check their early projections against real invoices and learn to distrust their own optimistic first numbers. |
| Normalcy bias | Navigating uncertaintyInvasive coverage sat at 42 percent for years, so it feels safe. Students must project the trajectory instead of assuming stability, and act before the acceleration data forces their hand. |
| Endowment effect | Emotional regulationAfter the Day 10 storm wrecks a zone they poured work into, students feel they cannot abandon it. The remedy is recognizing that I worked hard on this is a feeling, not a reason to keep spending. |
| Zero-risk bias | Adaptive strategySpending $45,000 for 100 percent eradication in one zone while four others decline feels safe and is a trap. Students learn to spread finite capital where it does the most good. |
| Hindsight bias | Productive failure recoveryOn Day 14 students claim they always knew soil was key, but their Day 2 journals say otherwise. Reading their own record turns a wrong early call into data instead of a verdict. |
15 days of data, decisions, and delayed feedback.
Day 0 sets the traps, with students researching the biases they will soon fall into. Then the case runs. Baseline ambition gives way to the first alarm, a stretch of heavy budget commitment, the Day 8 lag resolution that vindicates patient work, a storm, and a final reckoning. The pivots are engineered, not random.
| Day | What lands | Bias in focus |
|---|---|---|
| 0 | Orientation and the bias research activity. Students define the traps before they spring. | Naming the traps |
| 1-2 | Baseline data and first plans. Ambition runs high and success-story cases seed false confidence. | Survivorship bias |
| 3-4 | First alarm. Invasive acceleration data breaks the it has been fine for years assumption. | Normalcy bias |
| 5-7 | Commitment. Major budget decisions and the pull toward perfectionist 100 percent eradication. | Zero-risk bias |
| 8 | Lag resolution. Patient soil work overtakes flashy planting and the whole strategy is reframed. (critical pivot) | Endowment effect |
| 9 | Stakeholder navigation. The advisory board meeting forces a balance of five conflicting agendas. | Collaborative reasoning |
| 10 | The setback. A major storm event tests whether student work was resilient or fragile. (critical pivot) | Emotional regulation |
| 11-13 | Reassessment. Strategic recalibration and a final budget reckoning under tighter constraints. | Adaptive strategy |
| 14 | After-action report. Final dashboard analysis and a hindsight bias check against the Day 2 journals. | Productive failure recovery |
Standards alignment.
The Habitat targets the high school life science standards directly. Students analyze ecosystem dynamics and the factors affecting biodiversity and populations (HS-LS2-1, HS-LS2-2), evaluate evidence that complex interactions keep systems stable or push them to change (HS-LS2-6), and design and refine a restoration solution under cost and resource constraints (HS-LS2-7, HS-LS4-6). The work also builds the cross-cutting science practices: analyzing and interpreting data, using mathematics through the budget tracker, and constructing evidence-based arguments. Daily journals and the advisory board meeting draw on CCSS literacy in science, including citing specific textual and numerical evidence (RST.9-10.1) and supporting claims with reasoning (WHST.9-12.1).
The hidden architecture.
The whole simulation is built around one planted contradiction: the most ecologically sound choice, investing in dead soil, produces no visible result for nearly a week, while the worst choice, planting for instant green, looks like winning. The 2-3 day feedback lag is deliberate. It lets the Flashy Planter feel ahead long enough to commit hard, then the Day 8 lag resolution flips the standings as soil biology finally supports growth and unsupported seedlings die back. That single engineered moment is what forces the sound conclusion: patience and foundation beat speed and flash. The Day 10 storm and the final hindsight check exist to stop students from rewriting their own story. Their Day 2 journals are the receipt.
Turnkey, classroom-ready.
- An admin-ready lesson plan. A fully editable plan with standards alignment, daily pacing, differentiation, and assessment, ready to adapt to your district template. Included with every purchase.
- 15 daily teacher playbooks. One scripted session per day, with timing, the bias in play, and debriefing questions.
- 14 daily data releases. Scripted dashboard updates built to drop straight into your LMS each day.
- An Excel student workbook. A dashboard with automated budget tracking so students spend energy on judgment, not arithmetic.
- Ecology reference cards. Technical supports that let students research zones and interventions independently.
- A legacy and consequence report. Maps every decision branch and the five student archetypes for fast, informed feedback.
- A dual rubric system. Grades the quality of reasoning, not whether the preserve was saved.
Give your students a system that only rewards real thinking.
Bring The Habitat to your classroom and let your students learn, through 15 days of real consequences, that methodical evidence-led work outlasts the lucky guess.
Get this simulationPreview real pages from the simulation before you spend a dollar. No guessing, no surprises.