The Grid
The efficient grid is the fragile grid. Your students learn the difference before the storm hits.
See what your students get, and why it lands.
No mockups. Every page below is real, pulled straight from the files you download. Tap any one to see it full size.
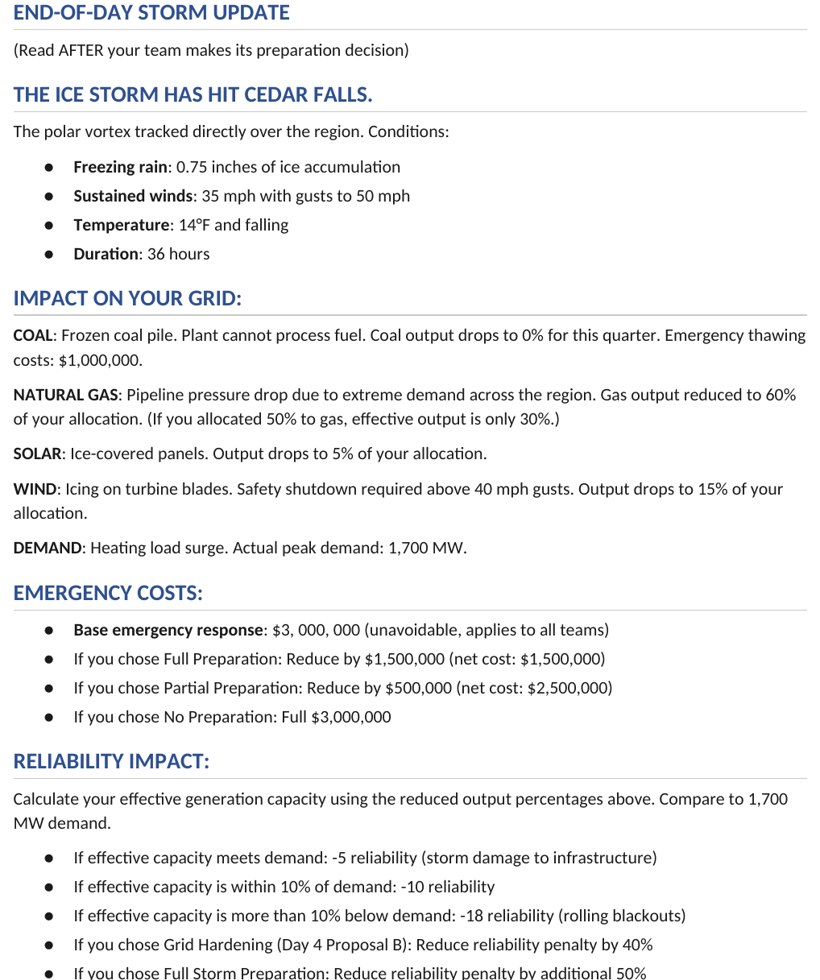
A worksheet was never going to teach this.
Each morning your students open a real data release for the Cedar Falls grid. Natural gas prices have jumped 12.5 percent. A coal plant inspection flags a 2.5 million dollar repair against a 15 percent efficiency drop. The forecast promises a sunny quarter at 28 percent capacity factor, and the actual generation lands at 14. Your students are not answering questions about energy. They are managing 1,200 megawatts of demand for 45,000 residents, balancing reliability, budget, and an environmental index that draws EPA fines when it climbs. They read the numbers, weigh the tradeoffs, and commit a portfolio for the quarter. The grid reacts. The next day's data is the consequence of the call they just made.
Tap to read a daily data release
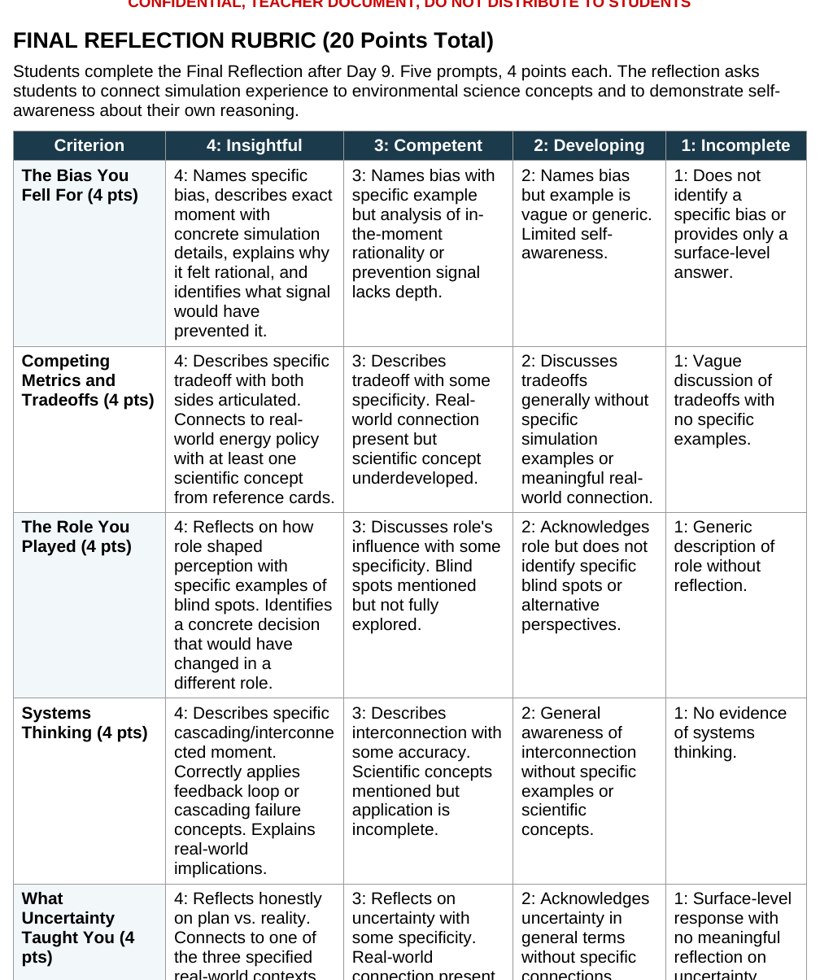
They are graded on the thinking, not the dashboard.
In a system driven by probabilistic events, a winning dashboard can come from luck and a failing one can come from sound reasoning wrecked by a bad roll. So the grade follows the reasoning. The daily journal is worth 16 points a day, 144 across the simulation, scored on decision documentation, reasoning quality that names the tradeoff, data usage that cites the actual prices and weather, and uncertainty awareness. A 20-point final reflection asks your students to identify the biases they fell for and connect the events to systems thinking. A team can keep the lights on by guessing and still score low. A team can take a justified hit from a 15 percent ice storm and score high. The rubric rewards the process that holds up over nine quarters.
Tap to read the grading rubric
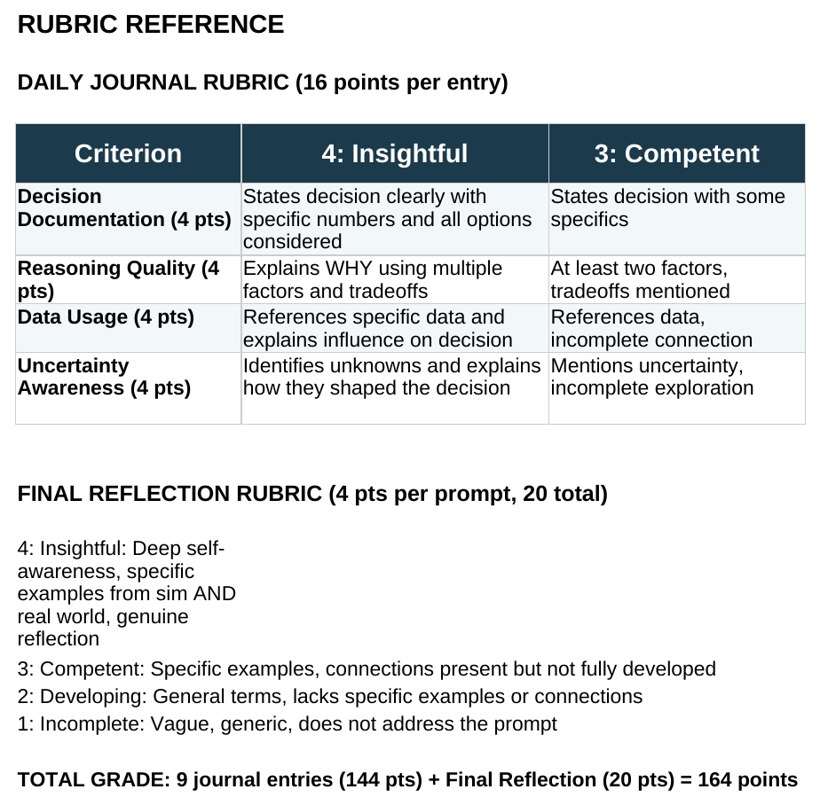
Let the workbook carry the math.
Every team gets an Excel workbook that holds the busywork. It tracks the 50 million dollar budget, the reliability score that starts at 85 percent, and the environmental index that starts at 72. It logs each quarter's energy mix, runs the capacity factor math, and updates the dashboard the moment a decision is entered. Your students do not lose an afternoon to arithmetic. They spend their energy on the judgment, which portfolio survives a storm, whether an 8 million dollar battery is worth a quarter of zero visible payoff. The workbook also makes the work AI-resistant. Each journal must reference the team's own idiosyncratic numbers, the exact budget swing after their specific Day 5 call, so a generic model cannot fake the cross-reference.
Tap to see the student workbook
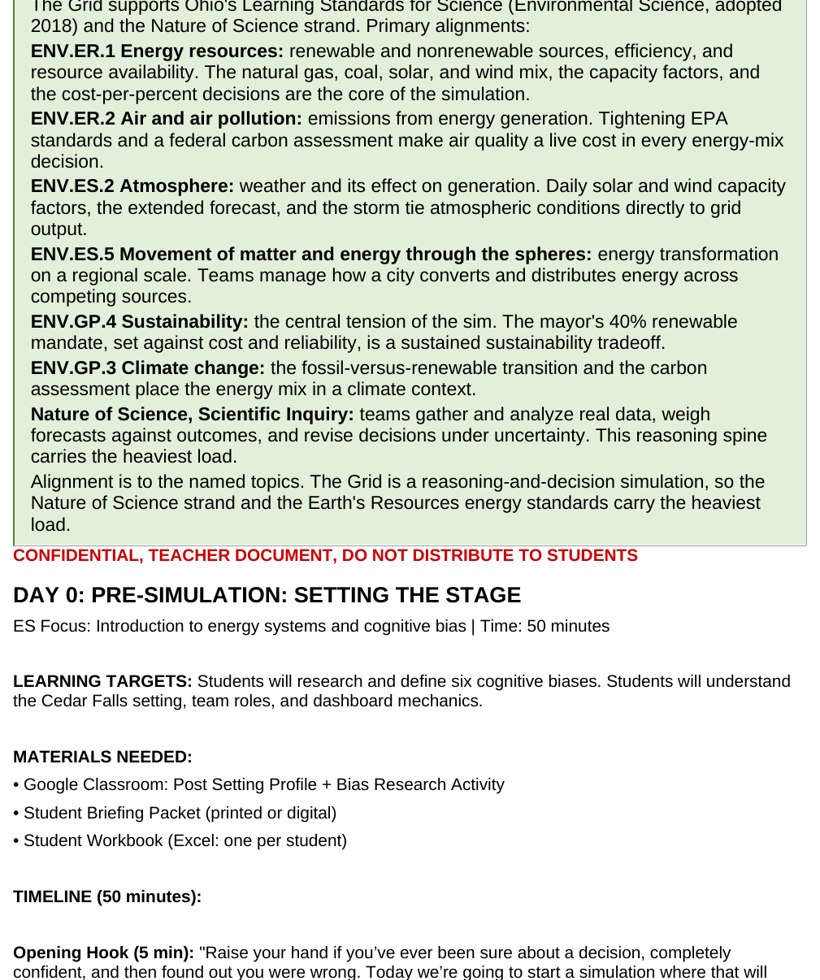
Every day is already scripted.
The teacher guide scripts all 10 days so your prep stays light. Each quarter has a playbook with the learning target, the event that lands that day, the data your students will see, and the prompts that surface the bias the day is built to expose. You know in advance that Day 4 hides the battery decision and Day 7 springs the cascading failure, so you can steer the debrief without scrambling. The guide names the national standard each cycle hits and the cognitive move it trains. You bring the facilitation and the questions. The simulation brings the data, the events, the rubric, and the answer key for the design. Open it, run the day, and let the grid do the teaching.
Tap to read the teacher guide
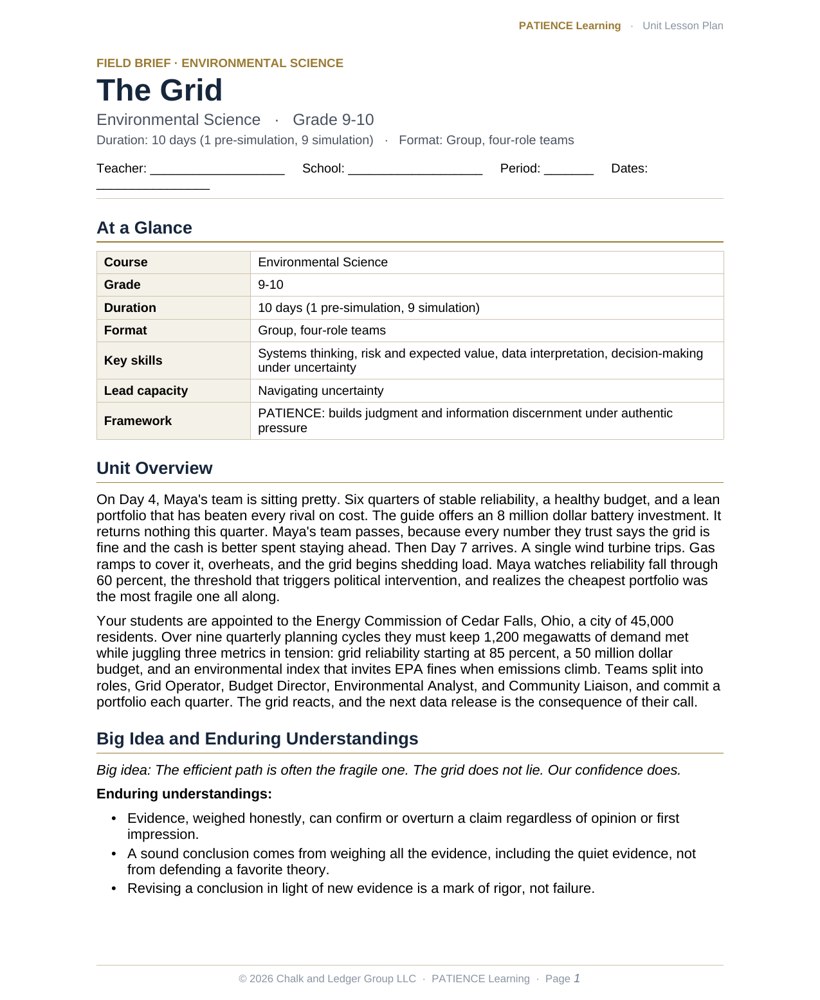
The lesson plan is already written.
Every simulation comes with a fully editable, admin-ready lesson plan. Standards alignment, daily pacing, learning objectives, differentiation, and an assessment plan are already done, so you can hand it to an administrator or adapt it to your district template in minutes.
Tap to preview the lesson plan
Close
Close
Close
Close
The day the efficient grid fell apart.
On Day 4, Maya's team is sitting pretty. Six quarters of stable reliability, a healthy budget, and a lean portfolio that has beaten every rival on cost. The guide offers an 8 million dollar battery investment. It returns nothing this quarter. Maya's team passes, because every number they trust says the grid is fine and the cash is better spent staying ahead. Then Day 7 arrives. A single wind turbine trips. Gas ramps to cover it, overheats, and the grid begins shedding load. Maya watches reliability fall through 60 percent, the threshold that triggers political intervention, and realizes the cheapest portfolio was the most fragile one all along.
The pivot is the moment the spreadsheet stops agreeing with her. The lean strategy that looked optimal for six quarters is now the reason the city is in the dark. Maya can protect the theory, blame the storm, and call it bad luck. Or she can trust what the cascade just showed her and rebuild around resilience instead of efficiency. When her team chooses the evidence, they see the lesson the simulation was built to deliver: a diversified, slightly more expensive mix would have absorbed the hit. The unseen infrastructure was the whole point. Resilience is not waste. It is the price of keeping the lights on.
The Energy Commission of Cedar Falls, Ohio.
Your students are appointed to the Energy Commission of Cedar Falls, Ohio, a city of 45,000 residents. Over nine quarterly planning cycles they must keep 1,200 megawatts of demand met while juggling three metrics in tension: grid reliability starting at 85 percent, a 50 million dollar budget, and an environmental index that invites EPA fines when emissions climb. Teams split into roles, Grid Operator, Budget Director, Environmental Analyst, and Community Liaison, and commit a portfolio each quarter. The grid reacts, and the next data release is the consequence of their call.
| Grade level | 9-10 |
| Course | Environmental Science |
| Duration | 10 days (1 pre-simulation, 9 simulation) |
| Format | Group, four-role teams |
| Key skills | Systems thinking, risk and expected value, data interpretation, decision-making under uncertainty |
Engineering better thinkers.
Professional failure in resource management rarely comes from missing data. It comes from misreading the data through predictable mental misfires. Each quarter pairs one bias with the capacity that defeats it, so your students practice catching themselves in the moment a real call is on the line.
| Bias targeted | The remedy, built into the work |
|---|---|
| Status quo bias | Adaptive strategyTeams cling to last quarter's portfolio as gas prices rise 12.5 percent and a coal plant degrades. The remedy is rebalancing on evidence instead of inertia, treating the comfortable mix as a hypothesis to retest. |
| Optimism bias | Navigating uncertaintyA sunny forecast promises a 28 percent capacity factor and delivers 14 percent. Students learn to plan against actual generation and intermittency, not the hopeful number printed on the nameplate. |
| Neglect of probability | Information discernmentA 15 percent ice storm probability sounds low, so teams skip the 2 million dollar bracing and eat 3 million in emergency costs. The fix is calculating expected value rather than dismissing a risk by its label. |
| Present bias | MetacognitionSkipping the 8 million dollar battery on Day 4 saves cash now and leaves the grid defenseless on Day 7. Students practice thinking about their own discounting of future risk before they commit. |
| Bandwagon effect | Collaborative reasoningPressure to match Ridgewood's 100 percent renewable headline tests whether teams audit the claim, whose real reliability sits at 73 percent, or chase the popular story over their own data. |
| Confidence trap | Productive failure recoverySix quarters of stability breeds overconfidence and dropped buffers right before the cascade. The remedy is using the failure as information and rebuilding for resilience rather than defending the broken plan. |
10 days of decisions under pressure.
Day 0 sets up the bias research and the four team roles. Then the case moves through three phases: manageable baseline operations, rising volatility and risk, and a climactic cascading failure that pays off, or punishes, every earlier call. The arc is built so the efficient path quietly becomes the fragile one.
| Day | What lands | Skill in focus |
|---|---|---|
| 0 | Bias research and role assignment across the four-person commission | Collaborative reasoning |
| 1 | Establish the baseline 1,200 MW mix and calculate initial costs | Systems thinking |
| 2 | Gas prices spike and a coal inspection forces a 2.5 million dollar repair call | Adaptive strategy |
| 3 | A sunny forecast lures teams with 28 percent capacity that delivers 14 percent | Navigating uncertainty |
| 4 | The 8 million dollar battery decision, zero payoff now, the only Day 7 protection (critical pivot) | Metacognition |
| 5 | A 15 percent ice storm warning tests whether teams brace for 2 million | Information discernment |
| 6 | The Ridgewood bandwagon pressures teams to match a flawed renewable headline | Collaborative reasoning |
| 7 | A turbine trip triggers the cascading failure that punishes earlier shortcuts (critical pivot) | Productive failure recovery |
| 8 | Strategic resource allocation under scarcity to repair the grid | Adaptive strategy |
| 9 | Final dashboard lock-in and the Legacy Report debrief | Metacognition |
Standards alignment.
The Grid maps to the Next Generation Science Standards for high school. It targets the HS-ESS3 Earth and Human Activity expectations on energy and mineral resources through capacity factors and resource availability, and on air quality by internalizing emissions cost via EPA fines and carbon assessment. It connects daily weather and forecasts to real solar and wind intermittency, and the movement of matter and energy across competing sources, drawing on HS-PS3 energy concepts. On policy, the HS-ESS3 sustainability and climate-change expectations have teams balance a 40 percent renewable mandate against budget and reliability and frame the fossil-to-renewable transition, with engineering design (HS-ETS1) throughout. The work is operational, not theoretical. Students apply the science to keep a real grid running.
The hidden architecture.
The simulation is a pressure cooker engineered to reward resilience over efficiency. The trap is path-dependent. The 8 million dollar battery on Day 4 offers zero visible benefit, so present bias and a healthy dashboard push nearly every team to skip it. That choice quietly disarms the only defense against the Day 7 cascading failure, when a single turbine trip ramps gas, overheats, and sheds load. Teams that optimized for cost find their grid collapsing while the diversified teams absorb the hit. The planted contradiction is that the most efficient portfolio is the most fragile one. Once the cascade lands, the lesson is undeniable: the boring, slightly costlier, diversified mix was the resilient choice the whole time.
Turnkey, classroom-ready.
- An admin-ready lesson plan. A fully editable plan with standards alignment, daily pacing, differentiation, and assessment, ready to adapt to your district template. Included with every purchase.
- 10-day playbooks. Day-by-day facilitation with learning targets, the planted event, and the prompts that surface each bias.
- A tech-enabled Excel workbook. Tracks budget, reliability, the environmental index, and the energy mix, and runs the capacity factor math automatically.
- Turnkey student files. Daily data releases, role cards for the four-person commission, and the bias research for Day 0.
- A dual rubric system. Grades the quality of reasoning across 144 journal points and a 20-point final reflection, not whether the dashboard wins.
- An AI-resistant design. Journals must cite each team's idiosyncratic numbers, so a generic model cannot replicate the work.
Hand your students a grid and let the storm teach them.
Bring The Grid to your classroom and give your students a real system to run, a real failure to survive, and the judgment to choose resilience over the flashy guess.
Get this simulationPreview real pages from the simulation before you spend a dollar. No guessing, no surprises.