The Forecast
A perfect fit can be the most dangerous answer in the room.
See what your students get, and why it lands.
No mockups. Every page below is real, pulled straight from the files you download. Tap any one to see it full size.
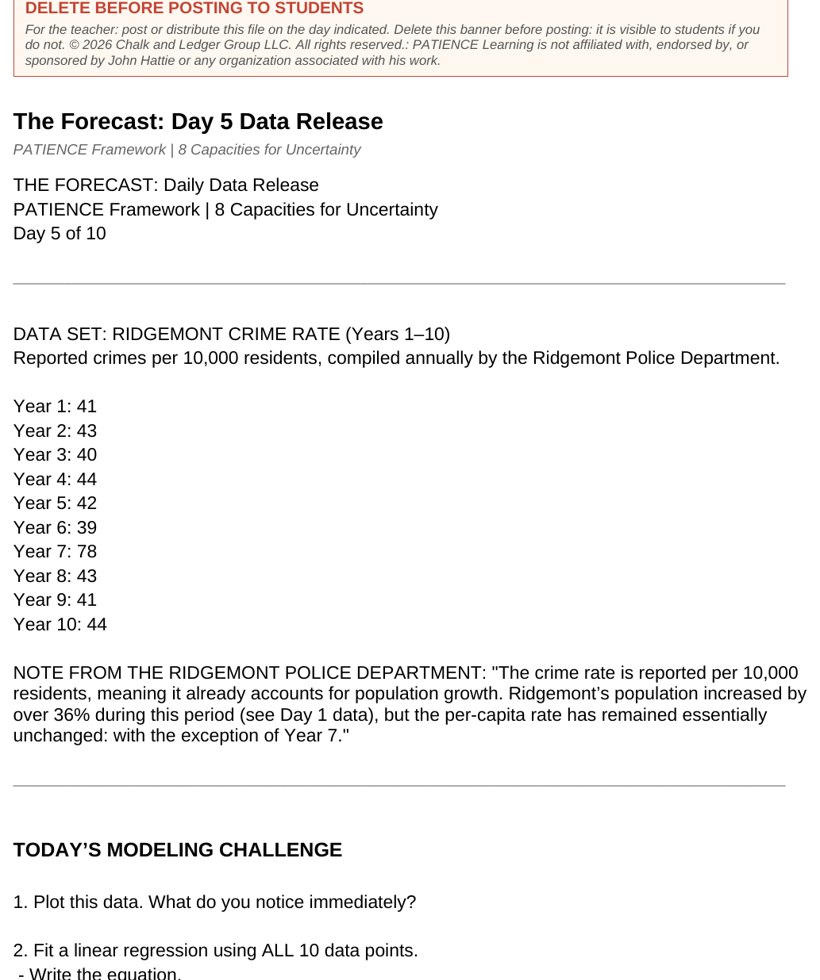
Your students are not solving for x. They are making a call the city is counting on.
This is a real daily release from the case. Your students work as a data analytics firm hired by Ridgemont, a town of 60,000 people. Each day a new dataset lands on their desk: population, tax revenue, school enrollment, housing starts, crime rate, water usage. They do not get a worksheet with a known answer at the back. They get raw numbers that curve, plateau, spike, and lie. From that evidence they choose a function family, fit a model, and forecast forward. The page asks for a defended decision, not a calculation. Pick the wrong model and the forecast they hand the city council falls apart in public. That pressure is the point.
Tap to see a case day
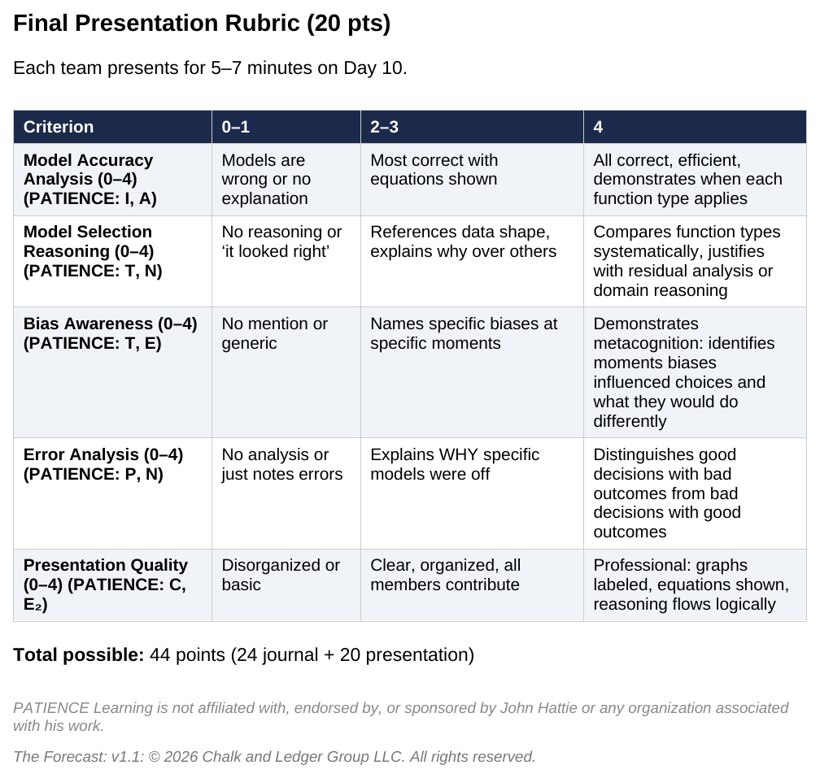
They are graded on how they reasoned, not on whether the forecast was lucky.
Here are the Dual Rubrics your students are measured against. One rubric scores the math: did they fit a sound function, check residuals, report a range instead of false precision. The other scores the reasoning traced in their daily journal: did they name the bias pulling at them, did they update when the evidence shifted, did they choose a domain-aware model over a flashy statistic. A team that picks a simple, honest model with a stated range of uncertainty can outscore a team that chased a perfect R-squared and got the number right by accident. A sound process behind a careful answer beats a lucky guess. The rubric makes that grading philosophy explicit, so the boring choice wins on paper too.
Tap to read the grading rubric
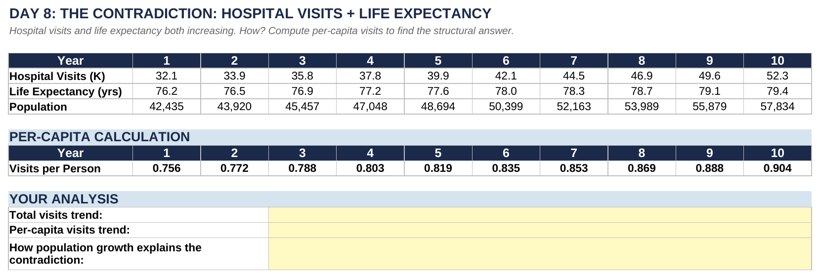
Let the workbook hold the busywork so the energy goes to judgment.
This is the student Workbook, a spreadsheet that does the arithmetic so your students can think. Each scenario arrives pre-loaded, so nobody spends the period typing in ten years of numbers. Students choose a function family, run the regression, and watch the R-squared and residuals update live. The tool surfaces the statistics, then steps back. It will not tell a team that a cubic fit with R-squared of 1.000 is a trap, and it will not warn them that their model predicts 930 million gallons of water for a town of 60,000. That call belongs to the student. By taking the computation off their plate, the workbook frees the whole session for the harder work: deciding which model the city should actually trust.
Tap to see the tracker
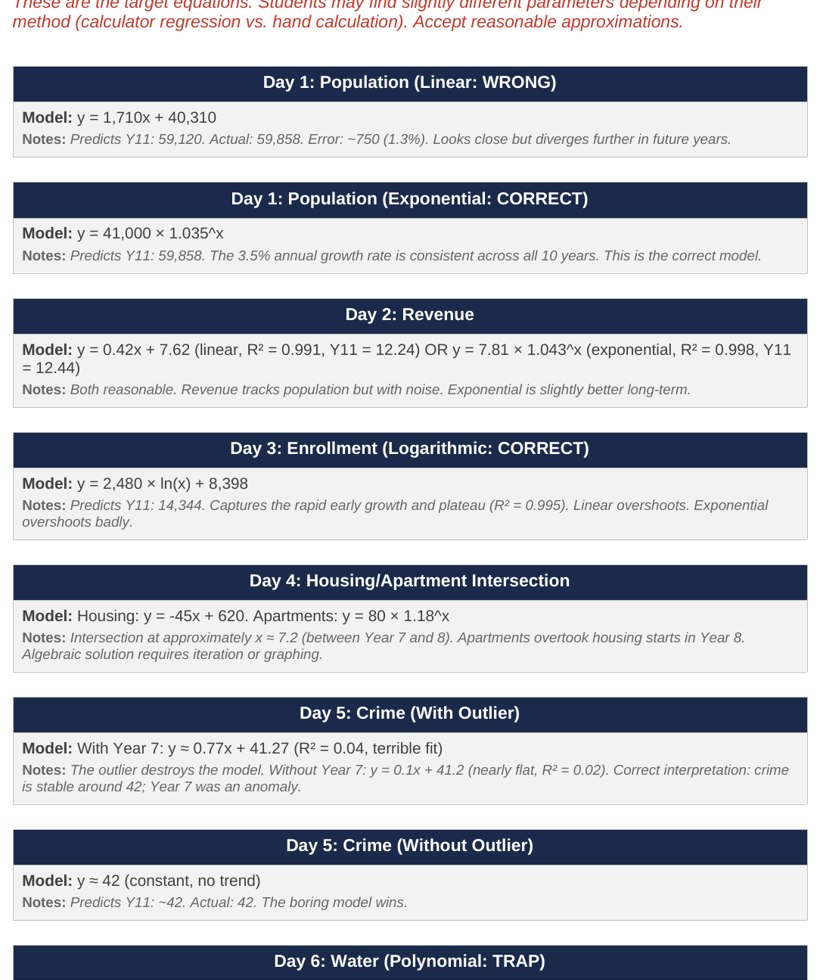
Every day is already scripted. You bring the facilitation, the simulation brings the rest.
This is the Teacher Guide, 13 playbooks that run minute by minute. Every session follows the same three-block rhythm: a 15-minute mini-lesson on the day's function family, 15 minutes of modeling and prediction in the workbook, then 15 minutes of journaling and pair share. The guide hands you the prompts, the discussion moves, and the reveal keys, including the Year 11 actuals you release on Day 9 to stress test every model in the room. You do not prepare a single dataset or invent a single prompt. Prep is light because the scripting is heavy. Your job is to facilitate the debate when a team's favorite model starts to crack, and the guide tells you exactly when that moment is coming.
Tap to read the teacher guide
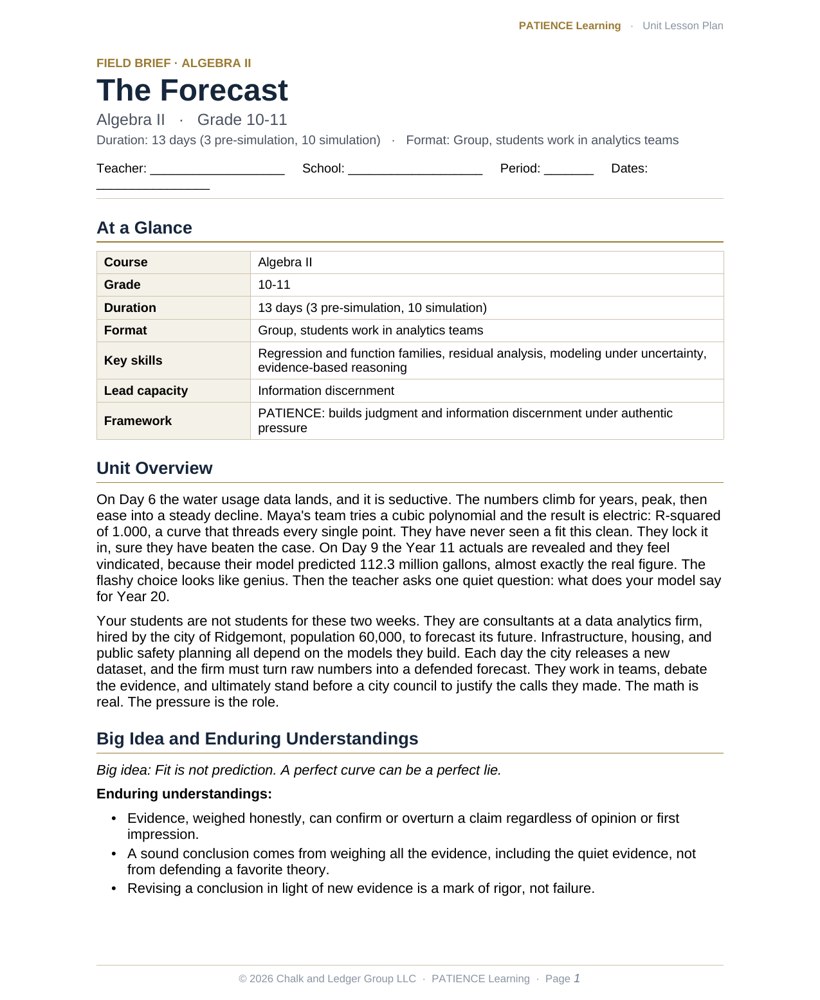
The lesson plan is already written.
Every simulation comes with a fully editable, admin-ready lesson plan. Standards alignment, daily pacing, learning objectives, differentiation, and an assessment plan are already done, so you can hand it to an administrator or adapt it to your district template in minutes.
Tap to preview the lesson plan
Close
Close
Close
Close
The day a perfect model predicts an impossible number.
On Day 6 the water usage data lands, and it is seductive. The numbers climb for years, peak, then ease into a steady decline. Maya's team tries a cubic polynomial and the result is electric: R-squared of 1.000, a curve that threads every single point. They have never seen a fit this clean. They lock it in, sure they have beaten the case. On Day 9 the Year 11 actuals are revealed and they feel vindicated, because their model predicted 112.3 million gallons, almost exactly the real figure. The flashy choice looks like genius. Then the teacher asks one quiet question: what does your model say for Year 20.
Maya runs the forecast and the screen returns 930 million gallons, for a town of 60,000 people. The number is absurd. Her team faces the pivot every analyst eventually meets: defend the model that fit the past perfectly, or trust what the evidence is now screaming. They could rationalize the outlier away. Instead they pull the cubic, choose a simpler curve that respects how a real town actually uses water, and report a range instead of a single confident point. Once they let the perfect fit go, they see it plainly. The model was memorizing history, not predicting the future.
A data analytics firm hired by the city of Ridgemont.
Your students are not students for these two weeks. They are consultants at a data analytics firm, hired by the city of Ridgemont, population 60,000, to forecast its future. Infrastructure, housing, and public safety planning all depend on the models they build. Each day the city releases a new dataset, and the firm must turn raw numbers into a defended forecast. They work in teams, debate the evidence, and ultimately stand before a city council to justify the calls they made. The math is real. The pressure is the role.
| Grade level | 10-11 |
| Course | Algebra II |
| Duration | 13 days (3 pre-simulation, 10 simulation) |
| Format | Group, students work in analytics teams |
| Key skills | Regression and function families, residual analysis, modeling under uncertainty, evidence-based reasoning |
Engineering better thinkers.
In a world run on data, the dangerous skill is not running a regression, it is knowing which model to trust. The Forecast pairs each day's math with the bias most likely to corrupt it, then names the capacity that defeats that bias under real pressure.
| Bias targeted | The remedy, built into the work |
|---|---|
| Anchoring | Productive failure recoveryOn Day 1 teams lock into a familiar linear population model. When Day 2 evidence favors an exponential fit, recovery means abandoning the first model and rebuilding rather than defending the anchor. |
| Confirmation bias | MetacognitionThe R-squared of 1.000 on Day 6 confirms what students hoped, that they nailed it. The journal forces them to ask what the fit is hiding before they believe it. |
| Sunk cost fallacy | Adaptive strategyIn the Day 1 to Day 2 shift, teams resist scrapping linear work they spent time on. Adaptive strategy means re-modeling as evidence evolves, not protecting hours already invested. |
| Availability bias | Information discernmentThe dramatic Year 7 crime spike to 78 dominates discussion on Day 5. Discernment means weighing nine years of stable data near 42 over one vivid outlier. |
| Tunnel vision | Navigating uncertaintyOn Day 3 teams fixate on the last three flat enrollment years and miss the full logarithmic arc. Reporting a range instead of false precision keeps the whole picture in view. |
| Overconfidence | Emotional regulationThe perfect Day 6 fit breeds certainty that collapses at the Day 9 reveal. Regulation means holding steady through the stress test and updating without ego. |
13 days of evidence, models, and one hard reveal.
Three pre-simulation days build the toolkit: spotting signal versus noise, the function families and the R-squared warning, and a bias experiment on anchoring. The ten case days then march through Ridgemont's data, each introducing a new function type and a new trap, building toward the Day 9 reveal and the Day 10 defense.
| Day | What lands | Skill in focus |
|---|---|---|
| Pre 1 | Signal versus noise in raw patterns | Pattern recognition |
| Pre 2 | Function toolkit and the R-squared warning | Regression literacy |
| Pre 3 | Bias research and an anchoring experiment | Metacognition |
| 1 | Population growth, the familiar linear anchor | Linear regression |
| 2 | City tax revenue, the sunk cost moment | Exponential functions |
| 3 | School enrollment plateaus, the recency trap | Logarithmic functions |
| 4 | Housing starts cross apartment demand | Systems of equations |
| 5 | Crime rate stability and the Year 7 spike | Residuals and outliers |
| 6 | Water usage and the overfitting trap (critical pivot) | Polynomial regression |
| 7 | Business permits with missing data | Interpolation and uncertainty |
| 8 | Hospital visits, per-capita versus aggregate | Rational expressions |
| 9 | The stress test, Year 11 actuals revealed (critical pivot) | Error analysis |
| 10 | Final city council presentation and defense | Synthesis and defense |
Standards alignment.
The Forecast is built on the Algebra II modeling strand of the Common Core math standards. Students distinguish linear, exponential, logarithmic, and polynomial growth and choose among them, which is CCSS.MATH.CONTENT.HSF.LE.A.1. They fit functions to data and use those functions to solve problems, which is CCSS.MATH.CONTENT.HSS.ID.B.6, elevated here because students must judge which features of a dataset matter, such as excluding the Day 5 crime outlier to find the honest trend. The work also draws on interpreting regression and residuals under HSS.ID.B.6.B and reasoning about rates of change in HSF.IF.B.6. These standards are not merely met. They are exercised as professional judgment.
The hidden architecture.
The whole arc is engineered to spring on Day 6. The water usage data is shaped so a cubic polynomial yields a flawless R-squared of 1.000, which is irresistible to a team chasing the perfect fit. The trap is patient. On Day 9 the Year 11 actuals make the cubic look brilliant, predicting 112.3 million gallons against a near-identical real value, so overfit teams feel rewarded right when they should be skeptical. The contradiction only detonates on extrapolation: forecast to Year 20 and the cubic demands 930 million gallons for a town of 60,000. That impossibility is what forces the sound conclusion. Students cannot rescue the model with more math, so they must reach for domain-aware reasoning. Fit is not prediction. The number teaches it for you.
Turnkey, classroom-ready.
- An admin-ready lesson plan. A fully editable plan with standards alignment, daily pacing, differentiation, and assessment, ready to adapt to your district template. Included with every purchase.
- 13 daily playbooks. Minute-by-minute facilitation for every session, including the Day 9 reveal keys.
- A tech-enabled student workbook. Pre-loaded city data with live regression, R-squared, and residual outputs so energy goes to judgment.
- Turnkey student files. Briefing packets that establish the Ridgemont setting and a journal that traces every reasoning step.
- A dual rubric system. Grades the quality of reasoning, not whether they solve it.
- A Legacy and Consequence report. Sorts students into archetypes, the R-squared Chaser, the Linear Loyalist, the Methodical Analyst, for targeted feedback.
Move your students from the calculator to the boardroom.
Bring The Forecast to your Algebra II classroom and let your students discover, the hard way, that a perfect fit is not the same as the truth.
Get this simulationPreview real pages from the simulation before you spend a dollar. No guessing, no surprises.