The Drift
The most dangerous failure at the station is not a fouled heat exchanger. It is a failure of reasoning.
See what your students get, and why it lands.
No mockups. Every page below is real, pulled straight from the files you download. Tap any one to see it full size.
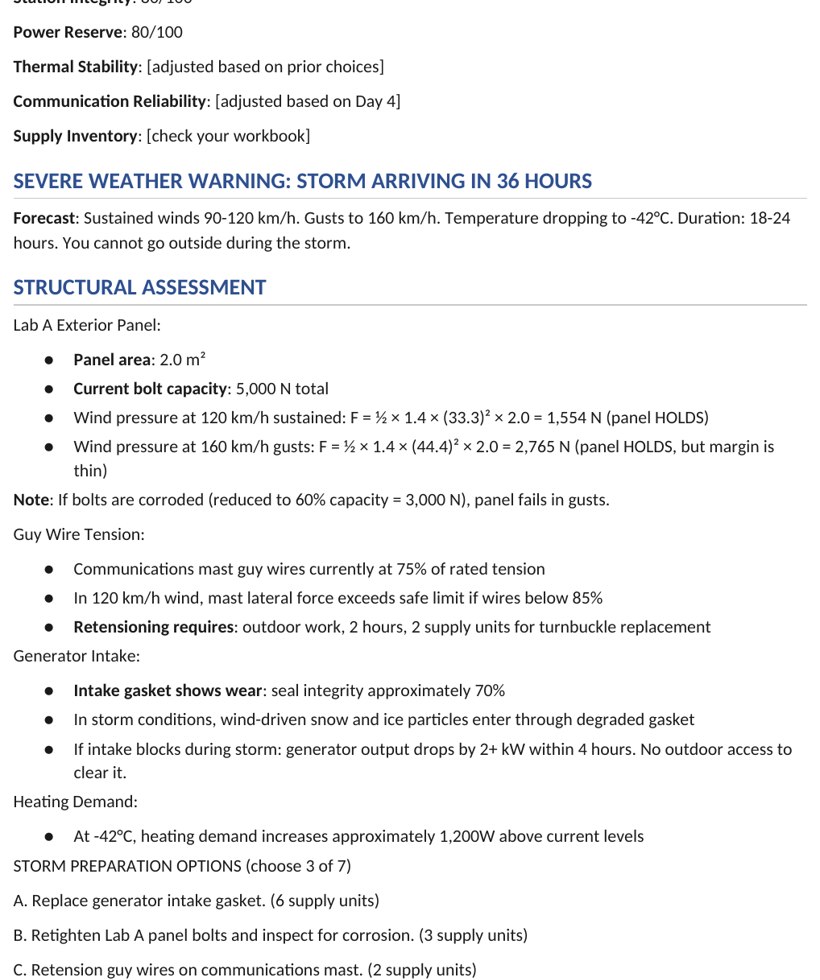
Your students are not answering questions. They are making the call.
Each day opens with a real data release from the Borealis station. On Day 1, a lab has dropped 5 degrees. Your students do not guess why. They run a heat balance, compare the conduction rate, and decide whether the cause is a failed thermocouple or a door someone propped open. One reading points to a 4-unit part. The other points to a free fix. With 100 supply units and 14 days of survival on the line, every release is a working technician's log, not a worksheet. Students read the numbers, apply the physics, and commit to a diagnosis they have to defend. The case does not tell them if they are right. The next day's data does.
Tap to see a case day
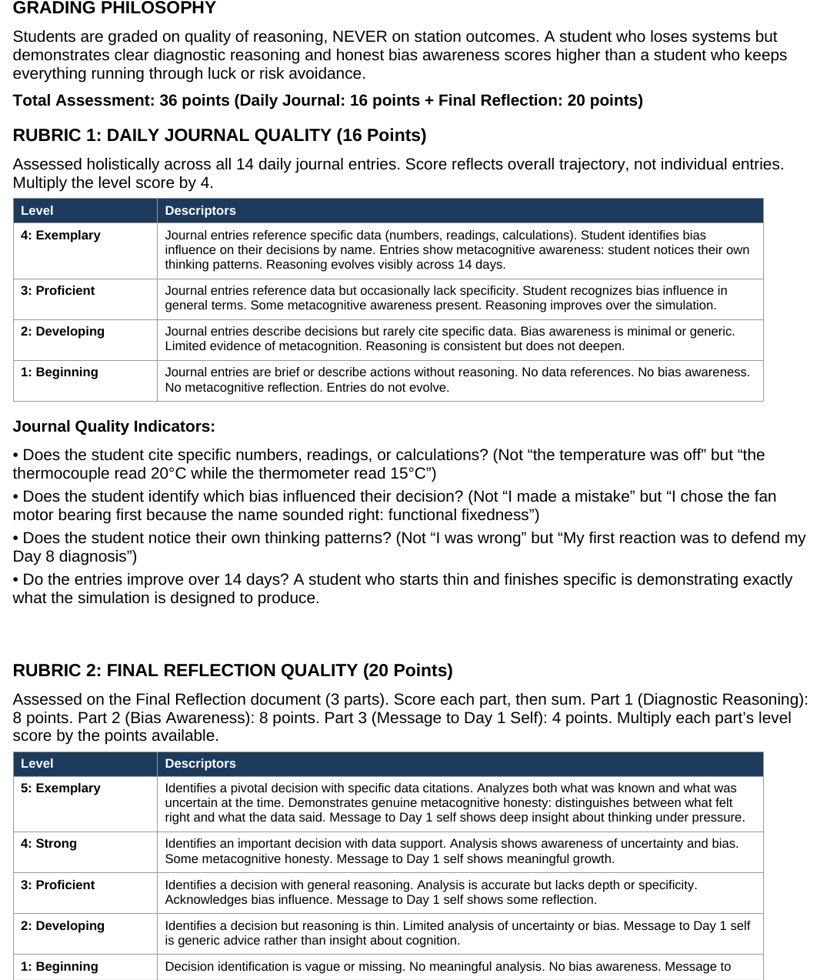
They are graded on their reasoning, not on saving the station.
The Drift uses a dual rubric. The Daily Journal is worth 16 points on a 4-point holistic scale that tracks the trajectory of growth, the use of specific data such as "the thermocouple read 20 degrees C," and whether the student names their own biases. The Final Reflection is worth 20 points and asks students to evaluate their most pivotal decision, admit a specific bias, and write a message to their Day 1 self. A student who claims two systems are connected but cannot explain the energy flow pathway scores lower than one who reasons carefully toward a wrong call. A sound process behind a flawed answer beats a lucky guess every time.
Tap to read the grading rubric
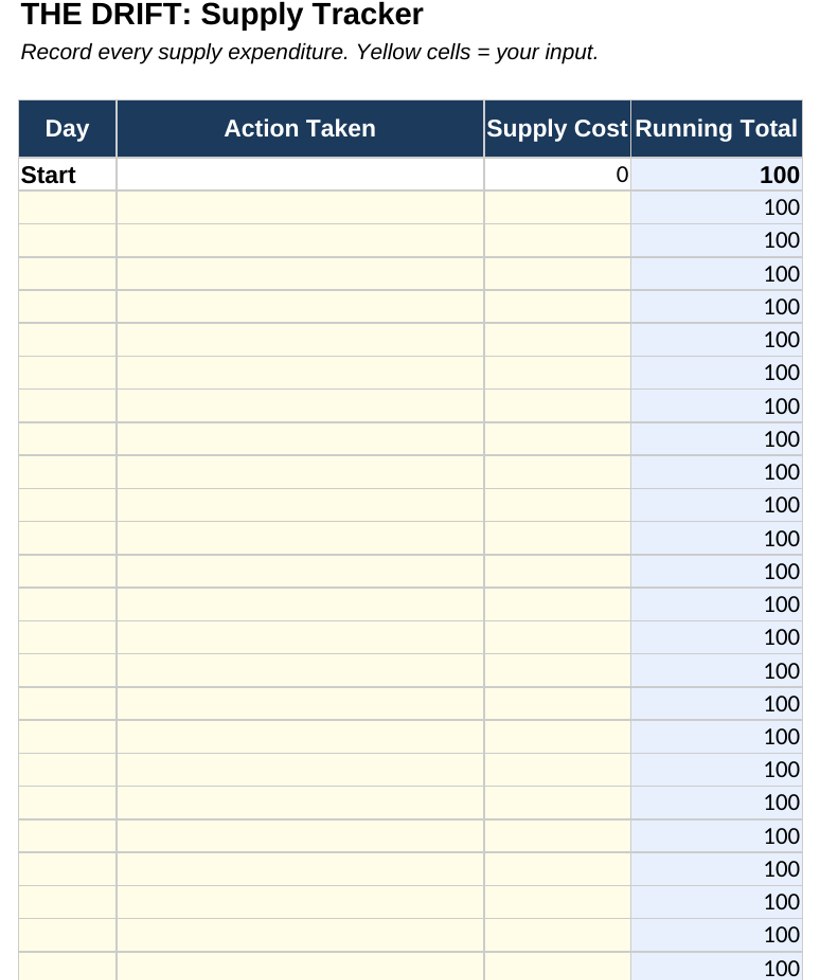
Let the workbook hold the busywork so the judgment stays with your students.
The student workbook is a tech-enabled spreadsheet that carries the five station metrics across all 15 days: Integrity, Power, Thermal, Comm, and Supply. It tracks the running supply balance after every decision, logs each day's readings, and lines up multi-day data so students can cross-reference logs and spot hidden correlations. When a voltage drop appears on Day 2, students are not reformatting tables. They are deciding whether it is a terminal fault or moisture in a junction box. The arithmetic and the bookkeeping live in the workbook. The diagnostic thinking stays where it belongs, with the student. That is where their energy goes.
Tap to see the tracker
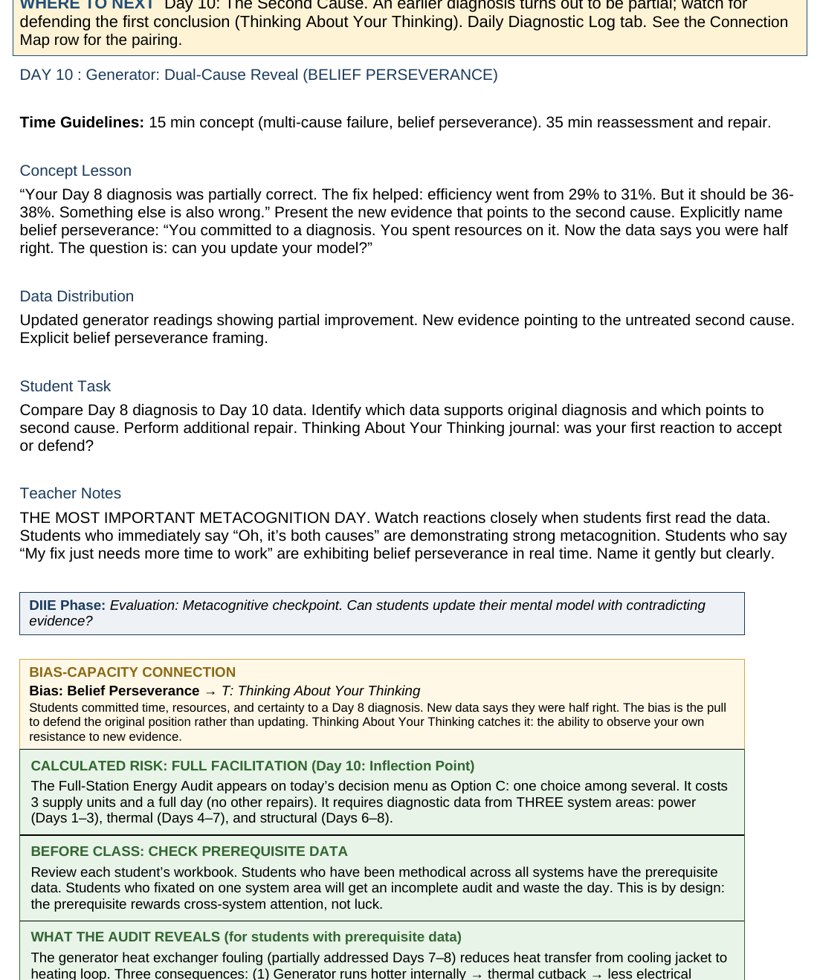
Every day is already scripted. You bring the facilitation, the simulation brings the rest.
The Teacher Guide scripts all 15 days. Each session is built for a 50-minute period: a 15-minute concept review on the day's physics domain, such as Ohm's Law or heat balance, then 35 minutes of data analysis, decision-making, and journal writing. The guide hands you the daily prompts, the exact data to release, and the answer behind each engineered choice, so you can run the simulation cold. The 15-day sequence is sequential but not clock-bound. Block days together, spread them across weeks, or run an intensive without breaking the internal logic. Grading stays light because assessment lives in two rubric-scored items. You facilitate. The simulation does the heavy lifting.
Tap to read the teacher guide
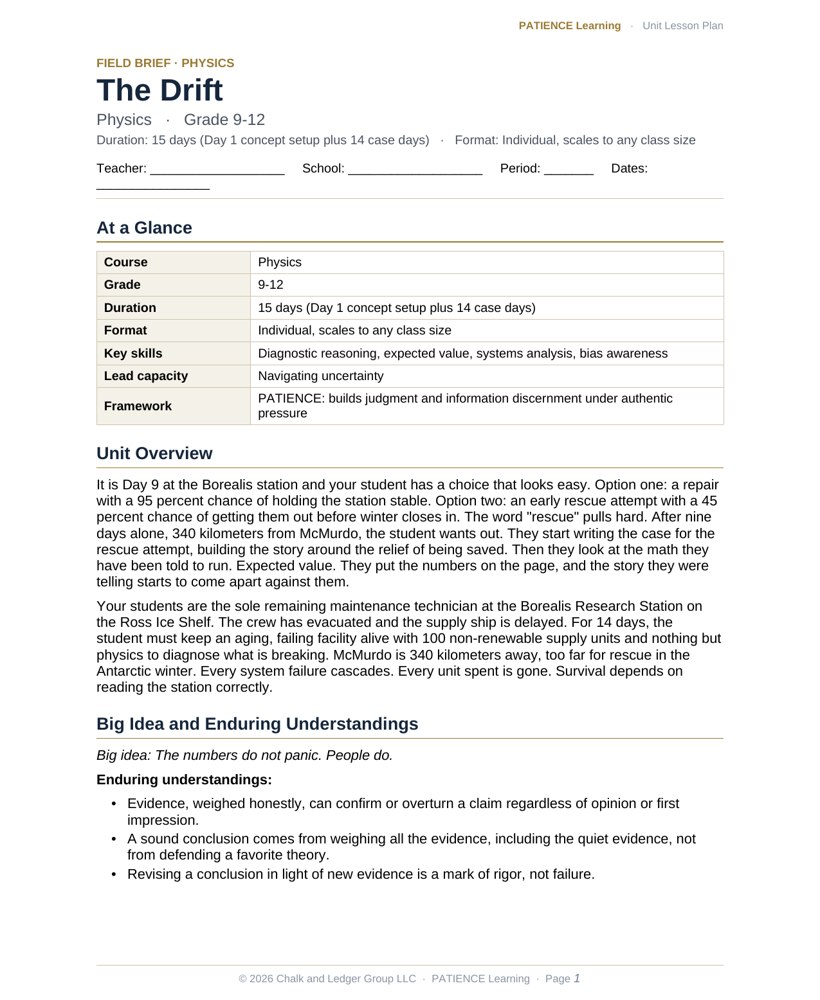
The lesson plan is already written.
Every simulation comes with a fully editable, admin-ready lesson plan. Standards alignment, daily pacing, learning objectives, differentiation, and an assessment plan are already done, so you can hand it to an administrator or adapt it to your district template in minutes.
Tap to preview the lesson plan
Close
Close
Close
Close
The day the 95 percent stopped feeling like a sure thing.
It is Day 9 at the Borealis station and your student has a choice that looks easy. Option one: a repair with a 95 percent chance of holding the station stable. Option two: an early rescue attempt with a 45 percent chance of getting them out before winter closes in. The word "rescue" pulls hard. After nine days alone, 340 kilometers from McMurdo, the student wants out. They start writing the case for the rescue attempt, building the story around the relief of being saved. Then they look at the math they have been told to run. Expected value. They put the numbers on the page, and the story they were telling starts to come apart against them.
A 45 percent chance is not an opportunity. It is a coin flip weighted toward death. The student sees that the 95 percent option is not a guarantee either, it is a 1-in-20 risk they have been treating as certain. Both feelings were lying. At the pivot, they have to choose between the diagnosis they wanted and the diagnosis the math supports. They cross out the rescue argument. They commit to the stable repair and write down why, in expected-value terms, not in hope. That is the moment the student stops being a survivor waiting to be saved and starts being a risk manager.
Alone at Borealis, 340 kilometers from help.
Your students are the sole remaining maintenance technician at the Borealis Research Station on the Ross Ice Shelf. The crew has evacuated and the supply ship is delayed. For 14 days, the student must keep an aging, failing facility alive with 100 non-renewable supply units and nothing but physics to diagnose what is breaking. McMurdo is 340 kilometers away, too far for rescue in the Antarctic winter. Every system failure cascades. Every unit spent is gone. Survival depends on reading the station correctly.
| Grade level | 9-12 |
| Course | Physics |
| Duration | 15 days (Day 1 concept setup plus 14 case days) |
| Format | Individual, scales to any class size |
| Key skills | Diagnostic reasoning, expected value, systems analysis, bias awareness |
Engineering better thinkers.
Discernment is survival here because the station never tells students what is wrong. It only gives them readings. Each day pairs a named bias that sabotages technical judgment with the capacity that overrides it, grounding both in the physics the student must actually compute.
| Bias targeted | The remedy, built into the work |
|---|---|
| Belief perseverance | Productive failure recoveryOn Day 10, data reveals the Day 8 diagnosis was only half right. Students must abandon the model they defended and rebuild from the new readings instead of protecting a conclusion that cost them units. |
| Contrast effect | MetacognitionOn Day 7, thermal sitting at 68 feels good next to a 58 storm low, yet it is below the 70-degree safety threshold. Students must notice they are judging against a bad baseline, not the standard. |
| Hyperbolic discounting | Adaptive strategyOn Day 12, an electric heater offers immediate warmth while burning fuel the station cannot spare. Students must choose 6 hours of cold insulation work for long-term survival over the instant relief. |
| Functional fixedness | Information discernmentOn Day 11, students must stop seeing a decommissioned alternator as an alternator and read its physical specs, a 12mm continuous-duty bearing that exactly fits the failing pump. |
| Disposition effect | Navigating uncertaintyOn Day 7, visible storm damage demands attention while a quiet glycol leak does the real harm. Students must weigh the invisible, catastrophic risk against the dramatic, visible one and act on the math. |
| Pseudocertainty effect | Emotional regulationOn Day 9, a 95 percent repair feels like a sure thing and a 45 percent rescue feels like a real chance. Students must hold the line, treat probabilities as probabilities, and let expected value decide. |
15 days of diagnosis under pressure.
Day 1 sets the method: physics is a detective tool, not a textbook hurdle. From there the case escalates. Single-system failures give way to contradictions, hidden leaks, and a buried root cause. Two pivot days force the student to update a defended diagnosis and to price risk with expected value rather than emotion.
| Day | What lands | Physics in focus |
|---|---|---|
| 1 | A cold lab: broken sensor or open door? Heat balance reveals the free fix. | Thermodynamics, heat balance |
| 2 | A voltage drop appears. Terminal fault or moisture in a junction box? | Electrical circuits, Ohm's Law |
| 5 | Cascading failures test triage as supply units thin out. | Energy efficiency, resource budgeting |
| 7 | Visible storm damage tempts the eye while a quiet glycol leak does the real harm. | Thermodynamics, fluid systems |
| 8 | A diagnosis is made on partial data and feels solid. | Waves and signal, diagnostics |
| 9 | 95 percent stability versus 45 percent rescue. Expected value over hope. (critical pivot) | Probability, expected value |
| 10 | Cross-system data exposes the generator heat exchanger as one shared root cause. (critical pivot) | Systems analysis, thermodynamics |
| 11 | An alternator is not an alternator. It is a 12mm bearing for the failing pump. | Rotational mechanics, specs |
| 12 | Immediate electric heat versus cold insulation work that saves fuel. | Thermodynamics, energy efficiency |
| 14 | The Station Handover Report: document every failure honestly for the incoming crew. | Synthesis, ethical reasoning |
Standards alignment.
The Drift is built on NGSS high school physical science. Students analyze data to support claims about energy transfer and develop models of thermal equilibrium under HS-PS3-1, HS-PS3-2, and HS-PS3-4, applying heat balance to diagnose the station's thermal failures. Force and structural analysis of wind pressure on panels draws on HS-PS2-1. Electrical diagnosis with Ohm's Law and wave and signal reasoning connect to HS-PS3-5 and HS-PS4-1. The simulation also exercises Science and Engineering Practices, including analyzing and interpreting data, using mathematics, and constructing evidence-based explanations, the heart of every daily journal.
The hidden architecture.
The pivot is engineered on Day 10. Throughout the first nine days, power, thermal, and structural metrics decline in ways that look like three separate problems, and most students treat them as such, spending roughly 15 units chasing symptoms one at a time. The planted truth is a single shared root cause: the generator heat exchanger. Students who cross-reference their multi-day logs see the correlation and perform one coordinated fix for 7 units. The reactive student keeps treating symptoms. Day 9 sets this up emotionally by tempting students to gamble on rescue, which drains attention from the data. Belief perseverance does the rest, because the convenient story of three separate faults is the one students least want to give up.
Turnkey, classroom-ready.
- An admin-ready lesson plan. A fully editable plan with standards alignment, daily pacing, differentiation, and assessment, ready to adapt to your district template. Included with every purchase.
- A 15-day teacher playbook. Day-by-day facilitation with prompts, data releases, and the answer behind every engineered choice, built for 50-minute periods.
- A tech-enabled workbook. Tracks all five station metrics and the running supply balance so students spend their energy on diagnosis, not arithmetic.
- Turnkey student files. The Borealis case days, data sets, and the Station Handover Report, ready to hand out cold.
- A dual rubric system. Scores the Daily Journal and Final Reflection on the quality of reasoning, not whether the station survives.
- Student archetype guidance. Named profiles such as the Fixer and the Systems Diagnostician, each with a growth-edge question for fast, targeted feedback.
Hand your students a station that is failing.
Bring The Drift to your physics classroom and let your students learn that careful reasoning, not a lucky guess, is what keeps the lights on.
Get this simulationPreview real pages from the simulation before you spend a dollar. No guessing, no surprises.